GPSAdb 2.0 — Atlas of Gene-Perturbation Transcriptomes
GPSAdb 2.0 is a comprehensive, open resource for exploring transcriptomic consequences of gene perturbations in human cell lines. The database hosts 7,665 perturbation groups (42,235 RNA-seq samples) covering 2,810 targeted genes across 1,063 cell lines, uniformly processed and richly annotated for cross-study analysis.
What you can do with GPSAdb 2.0
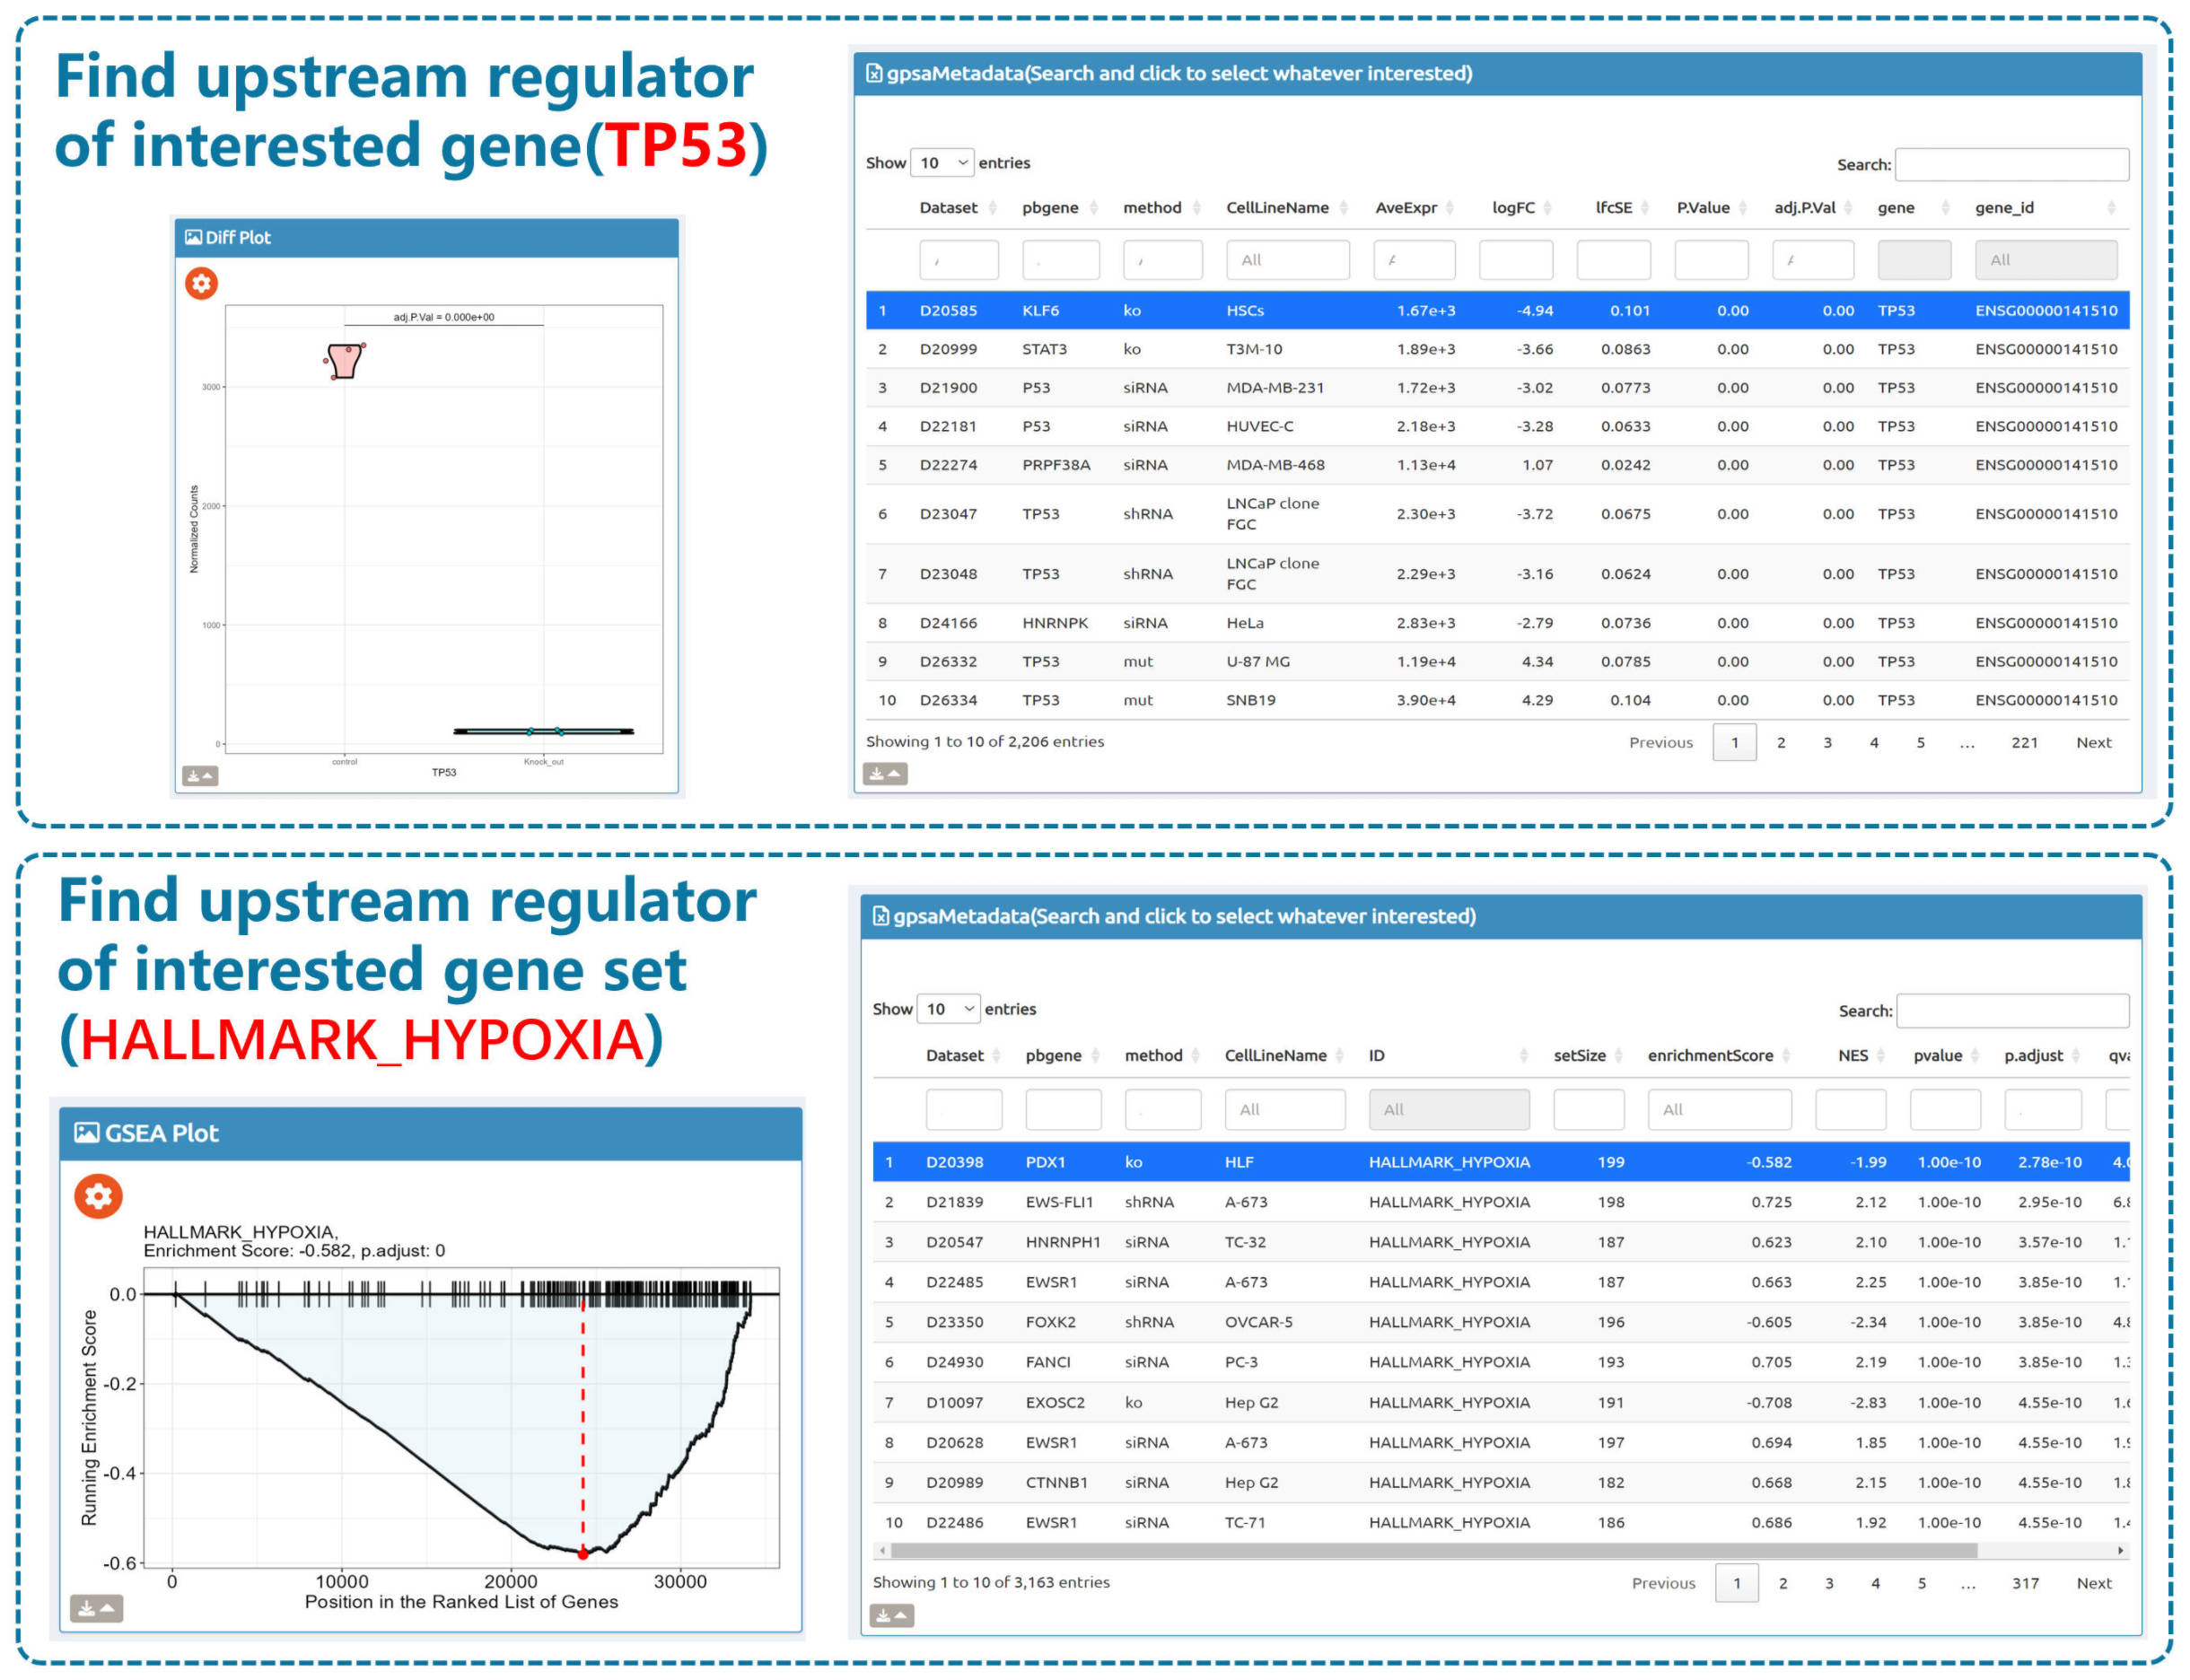
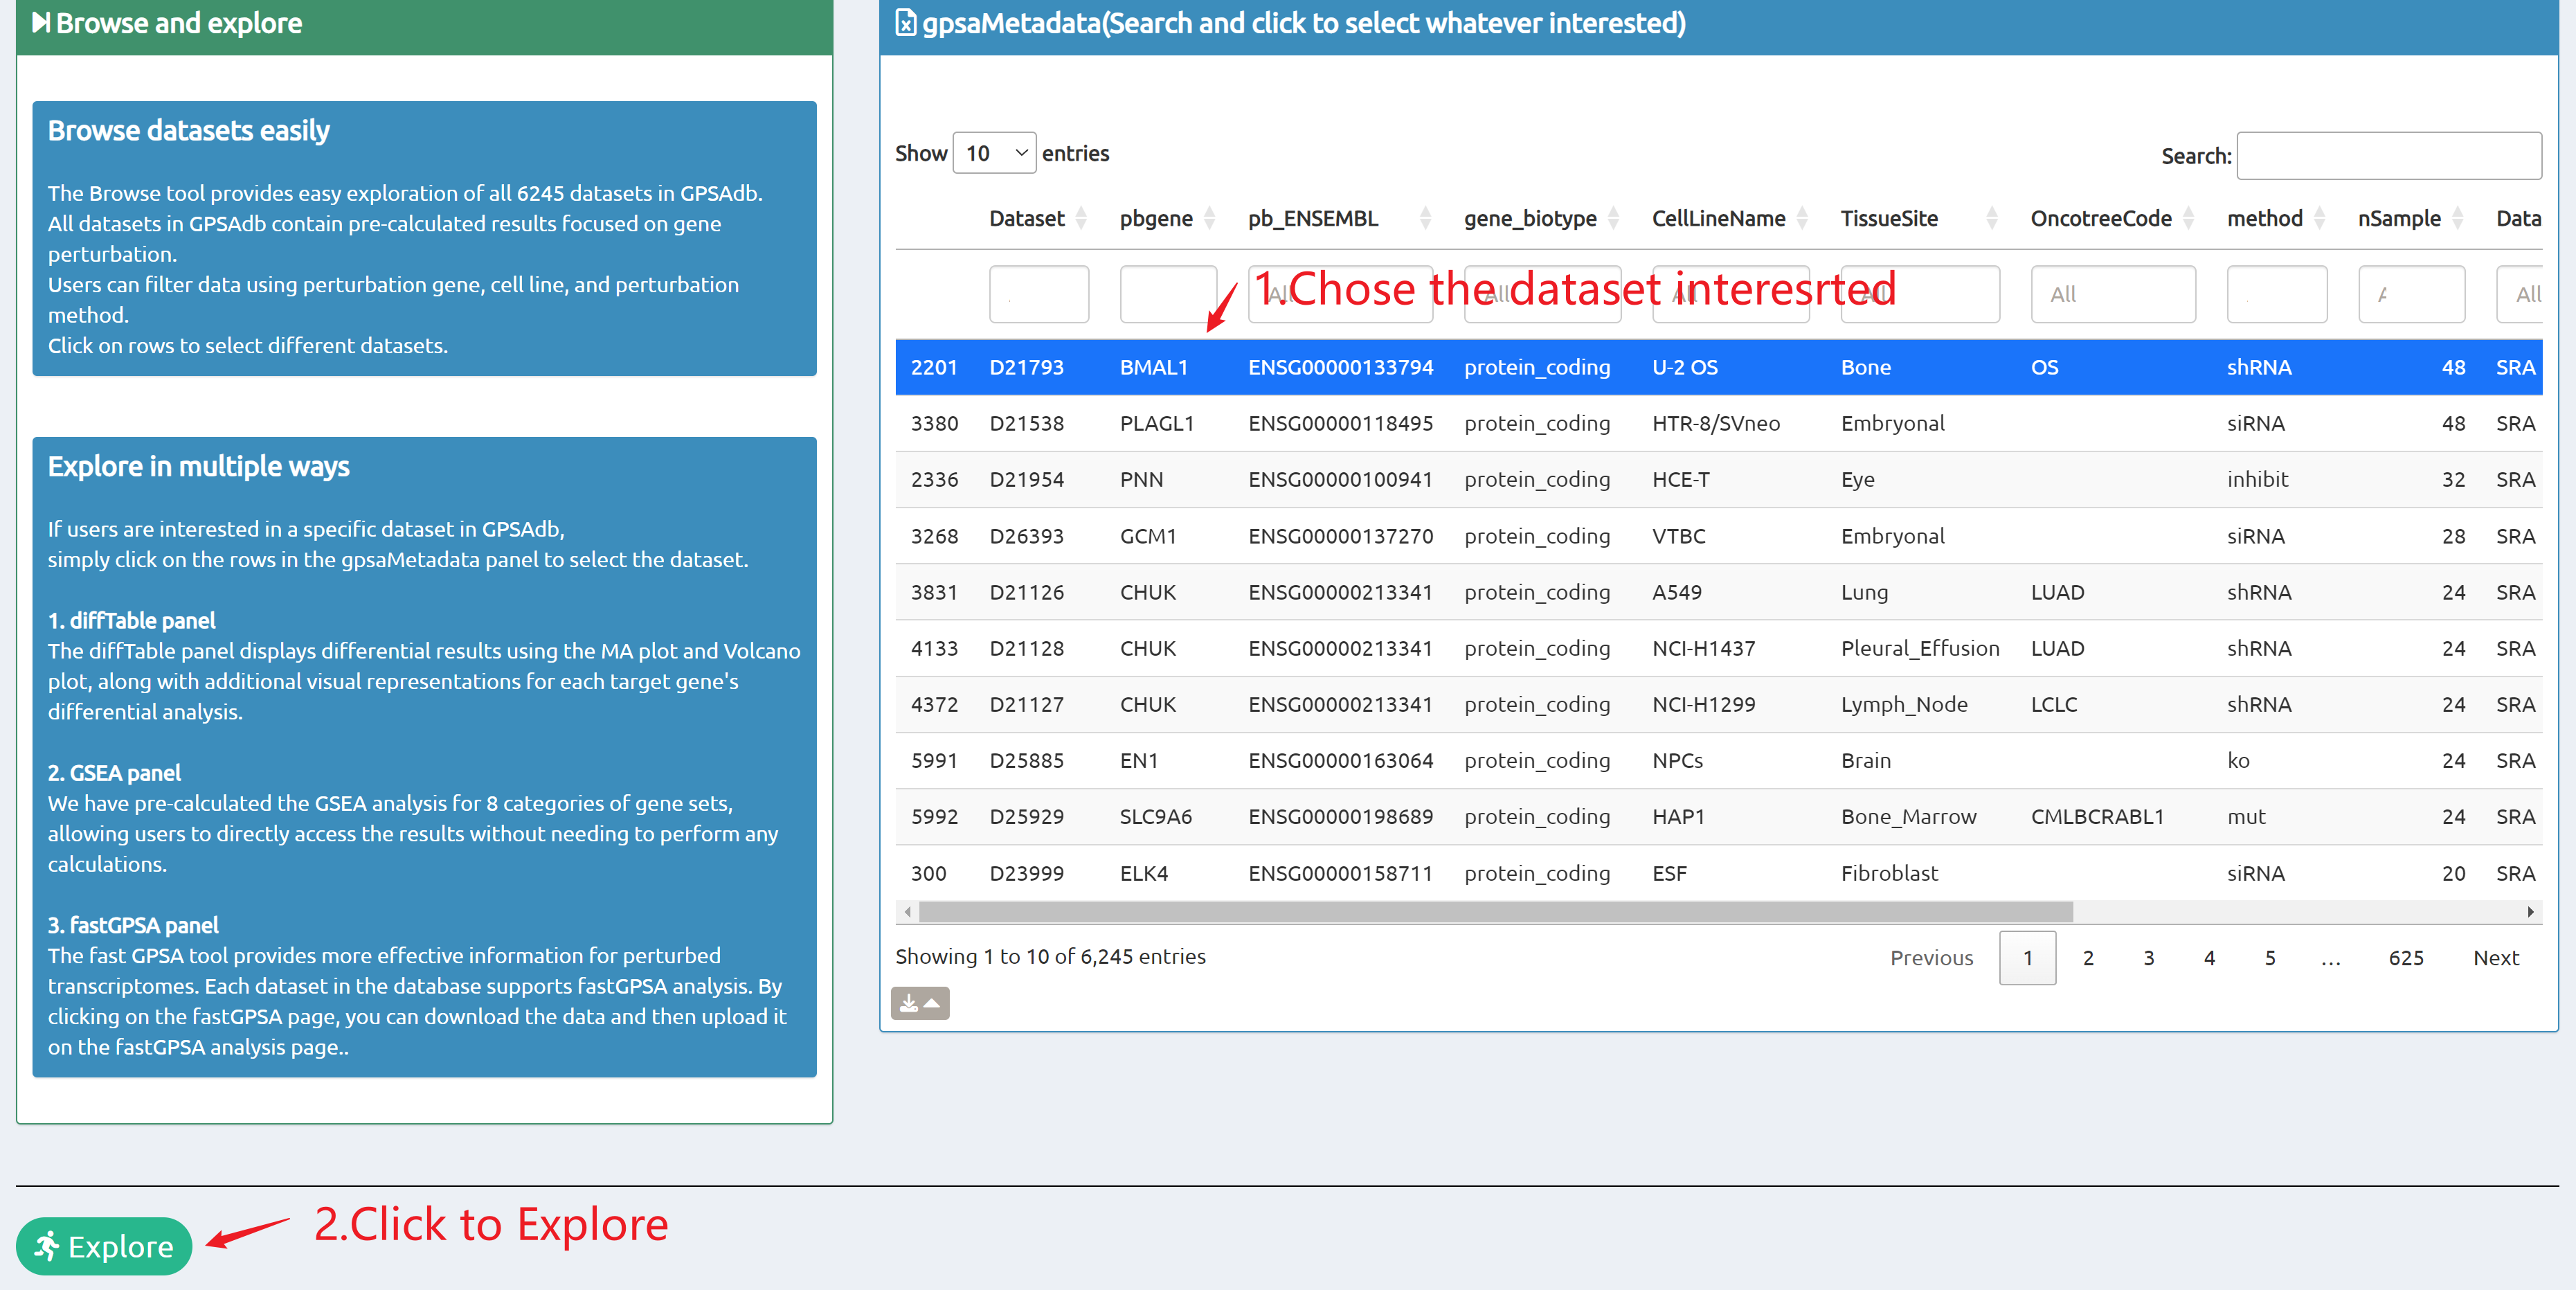
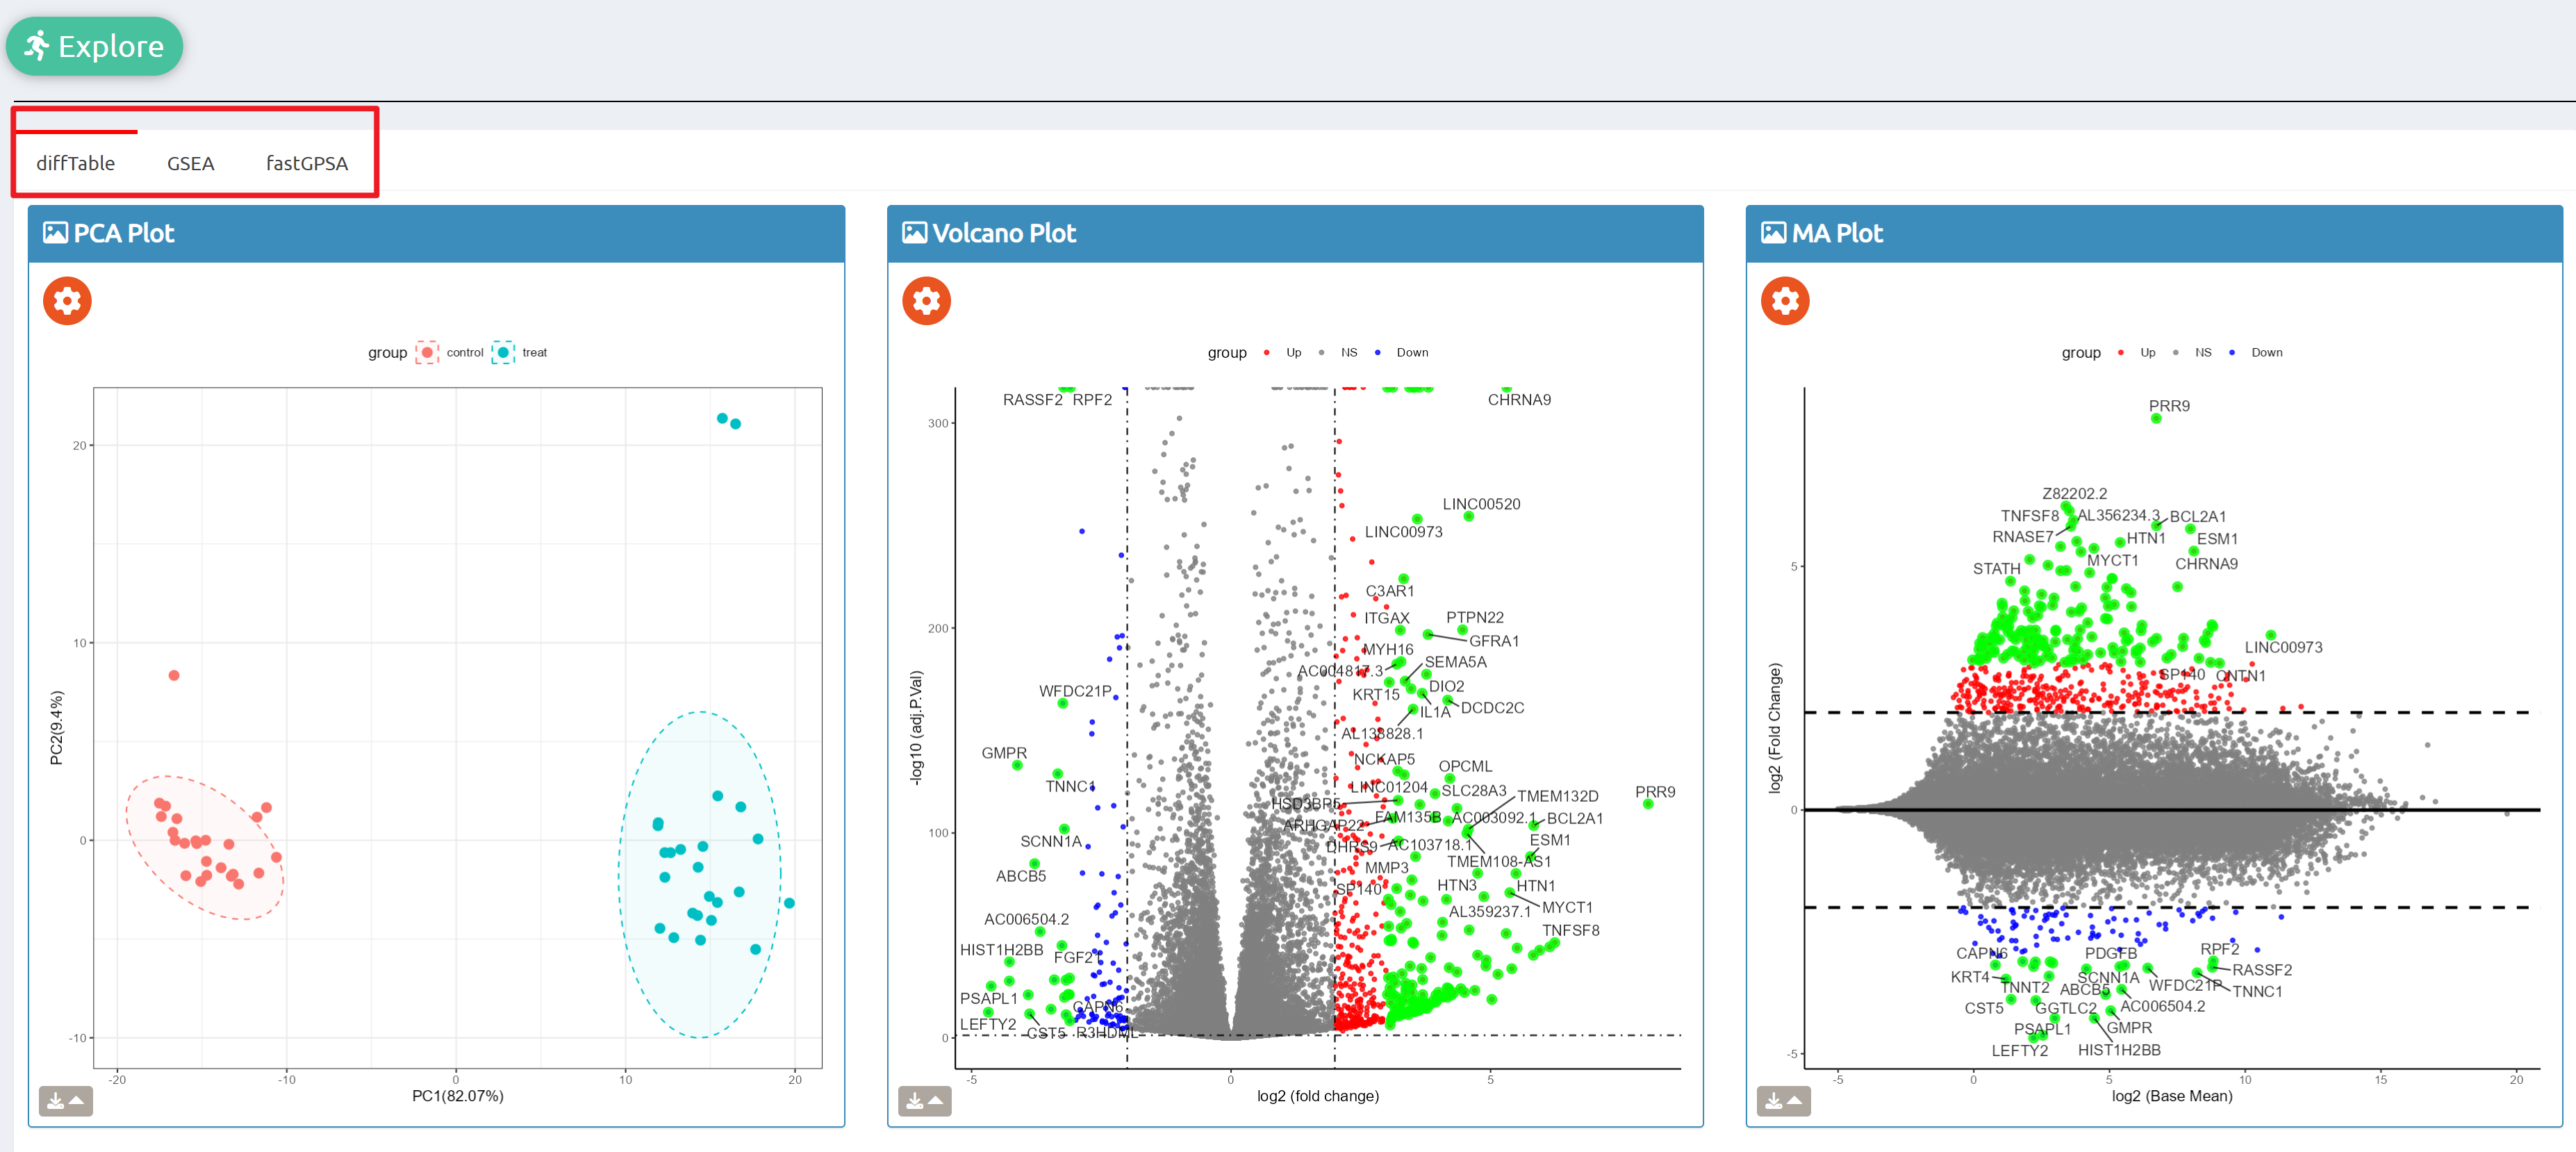
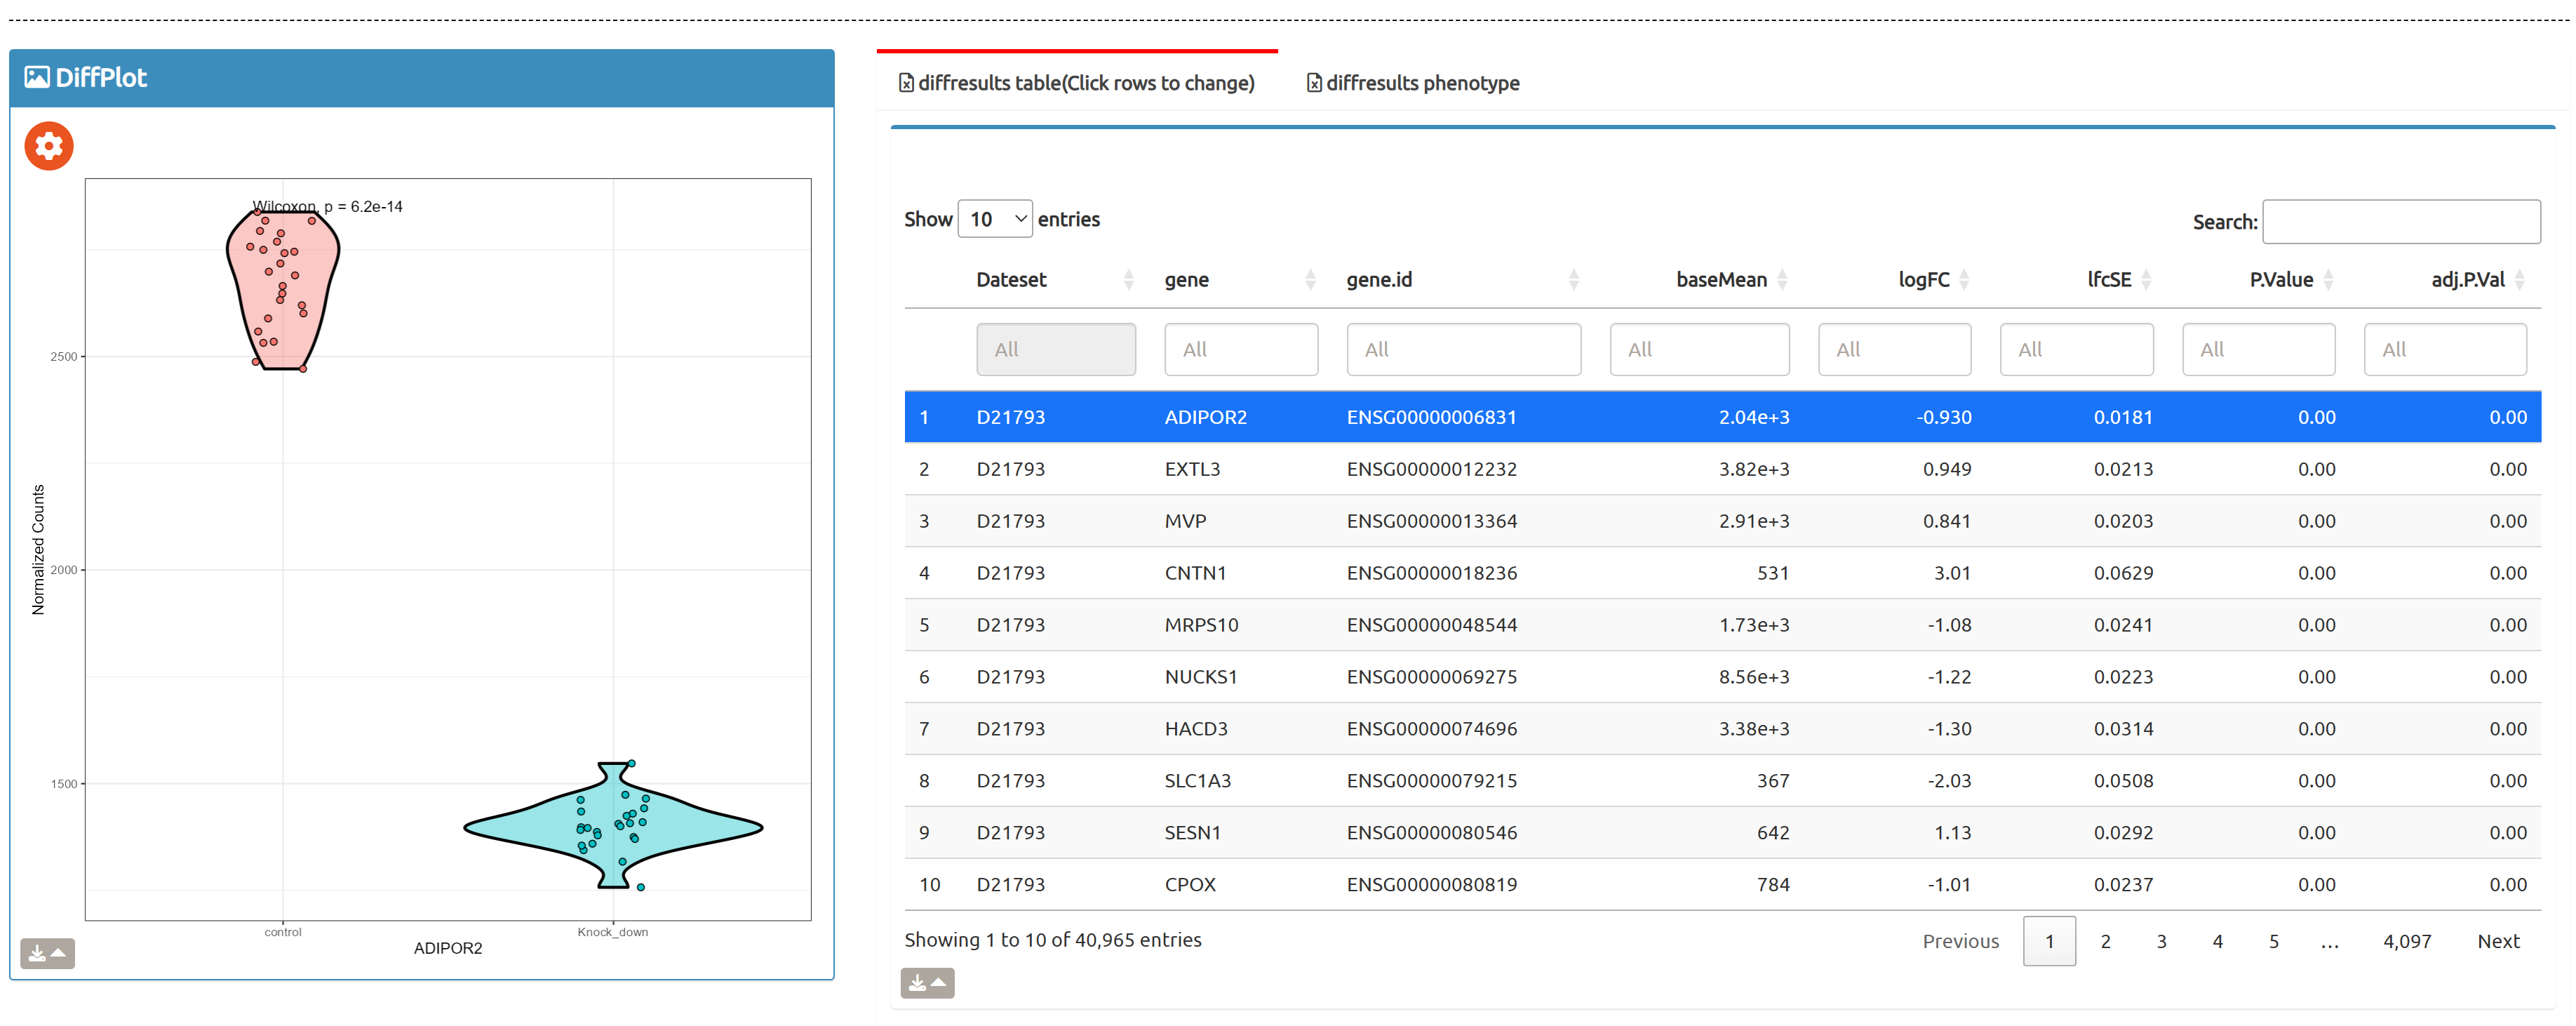
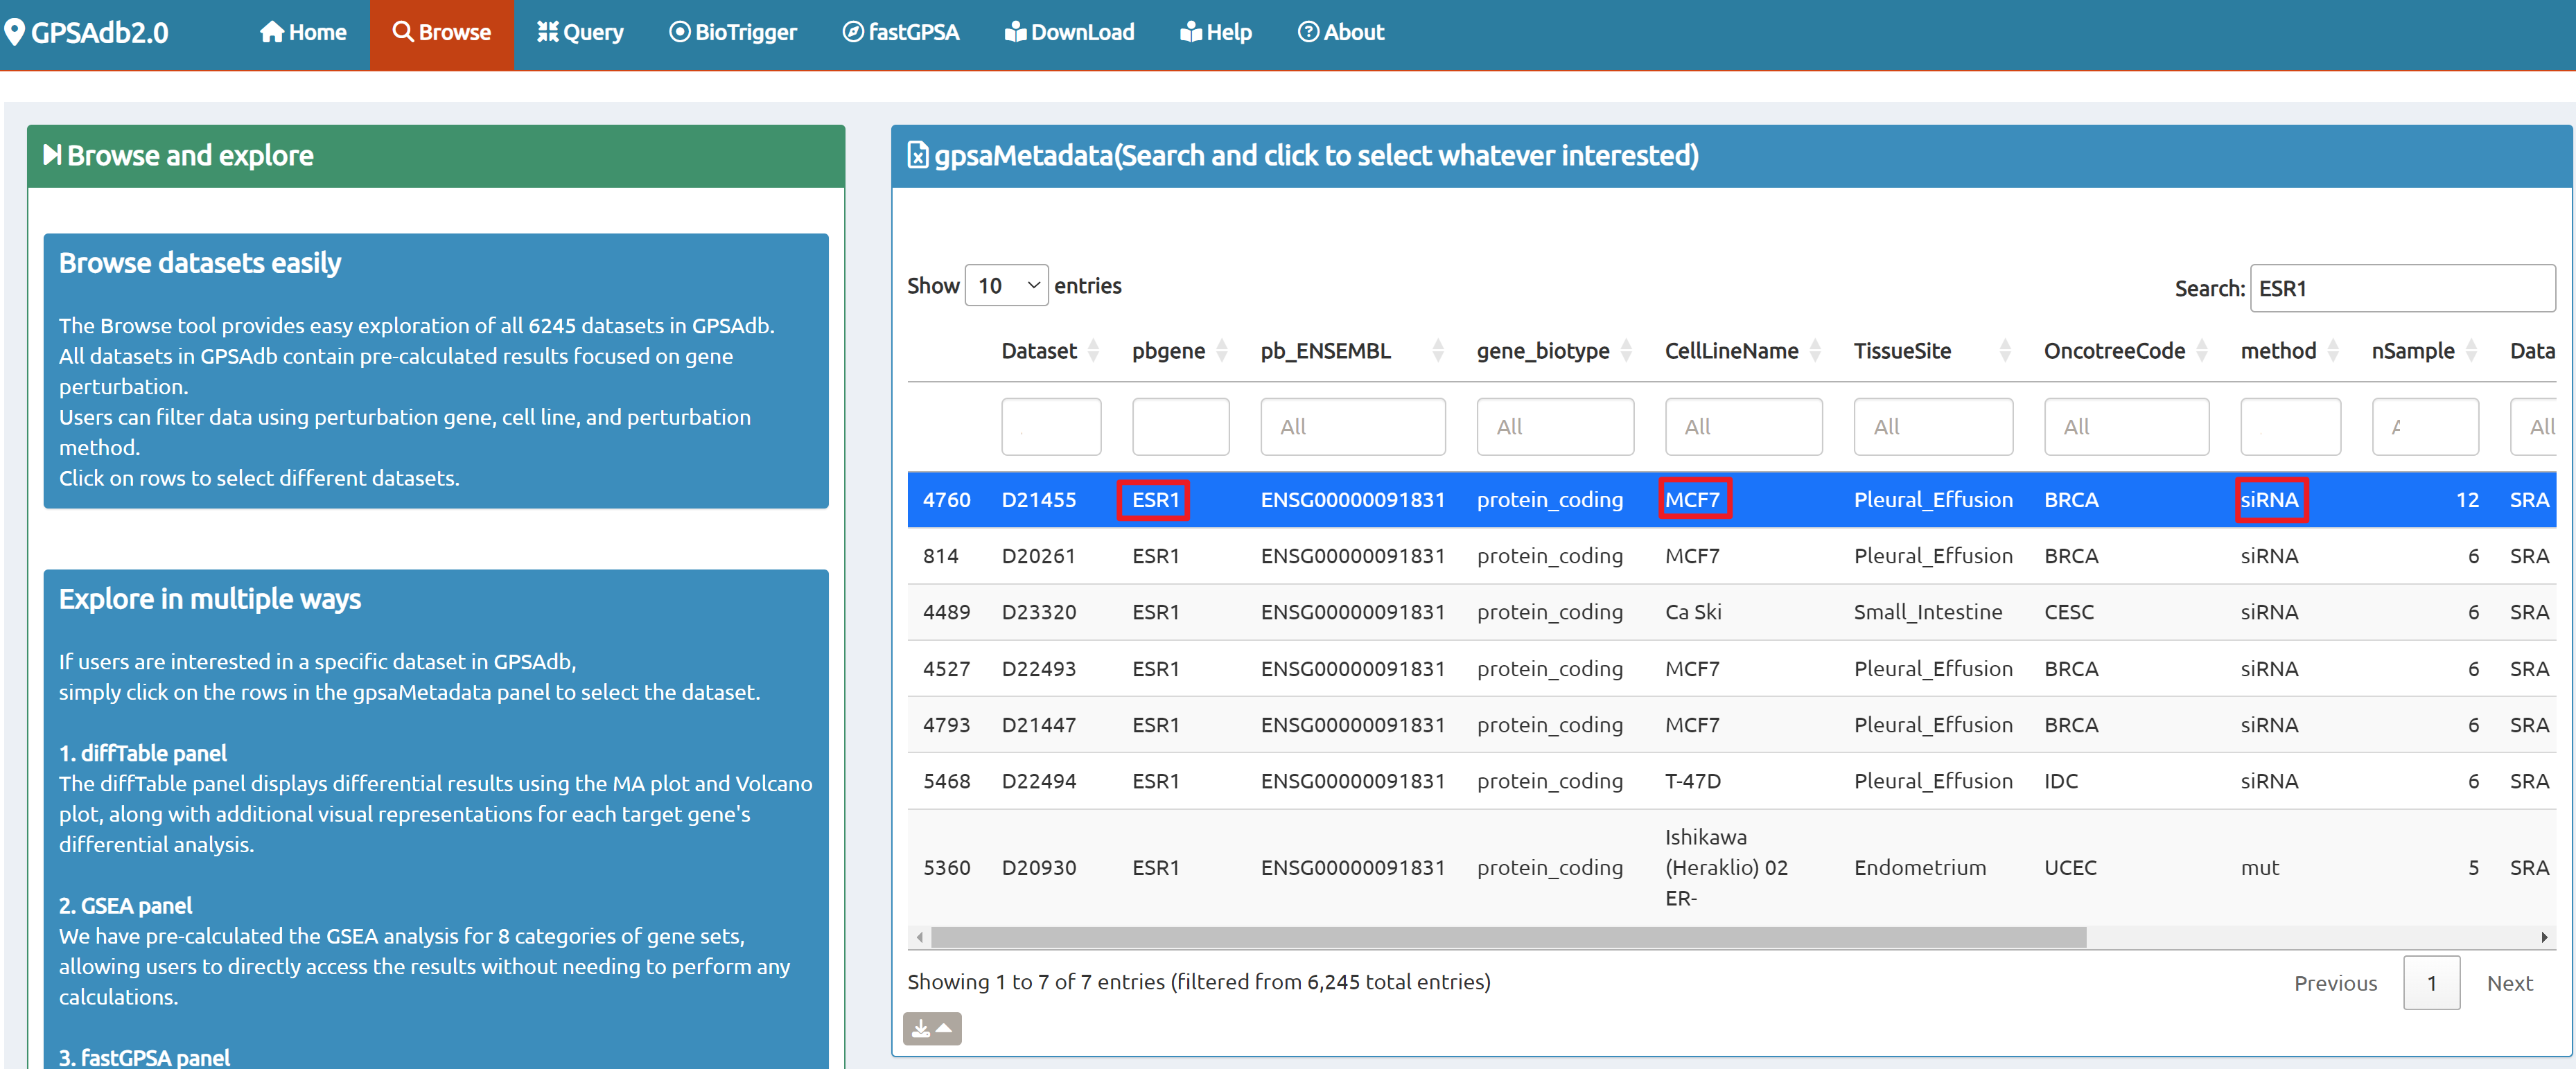
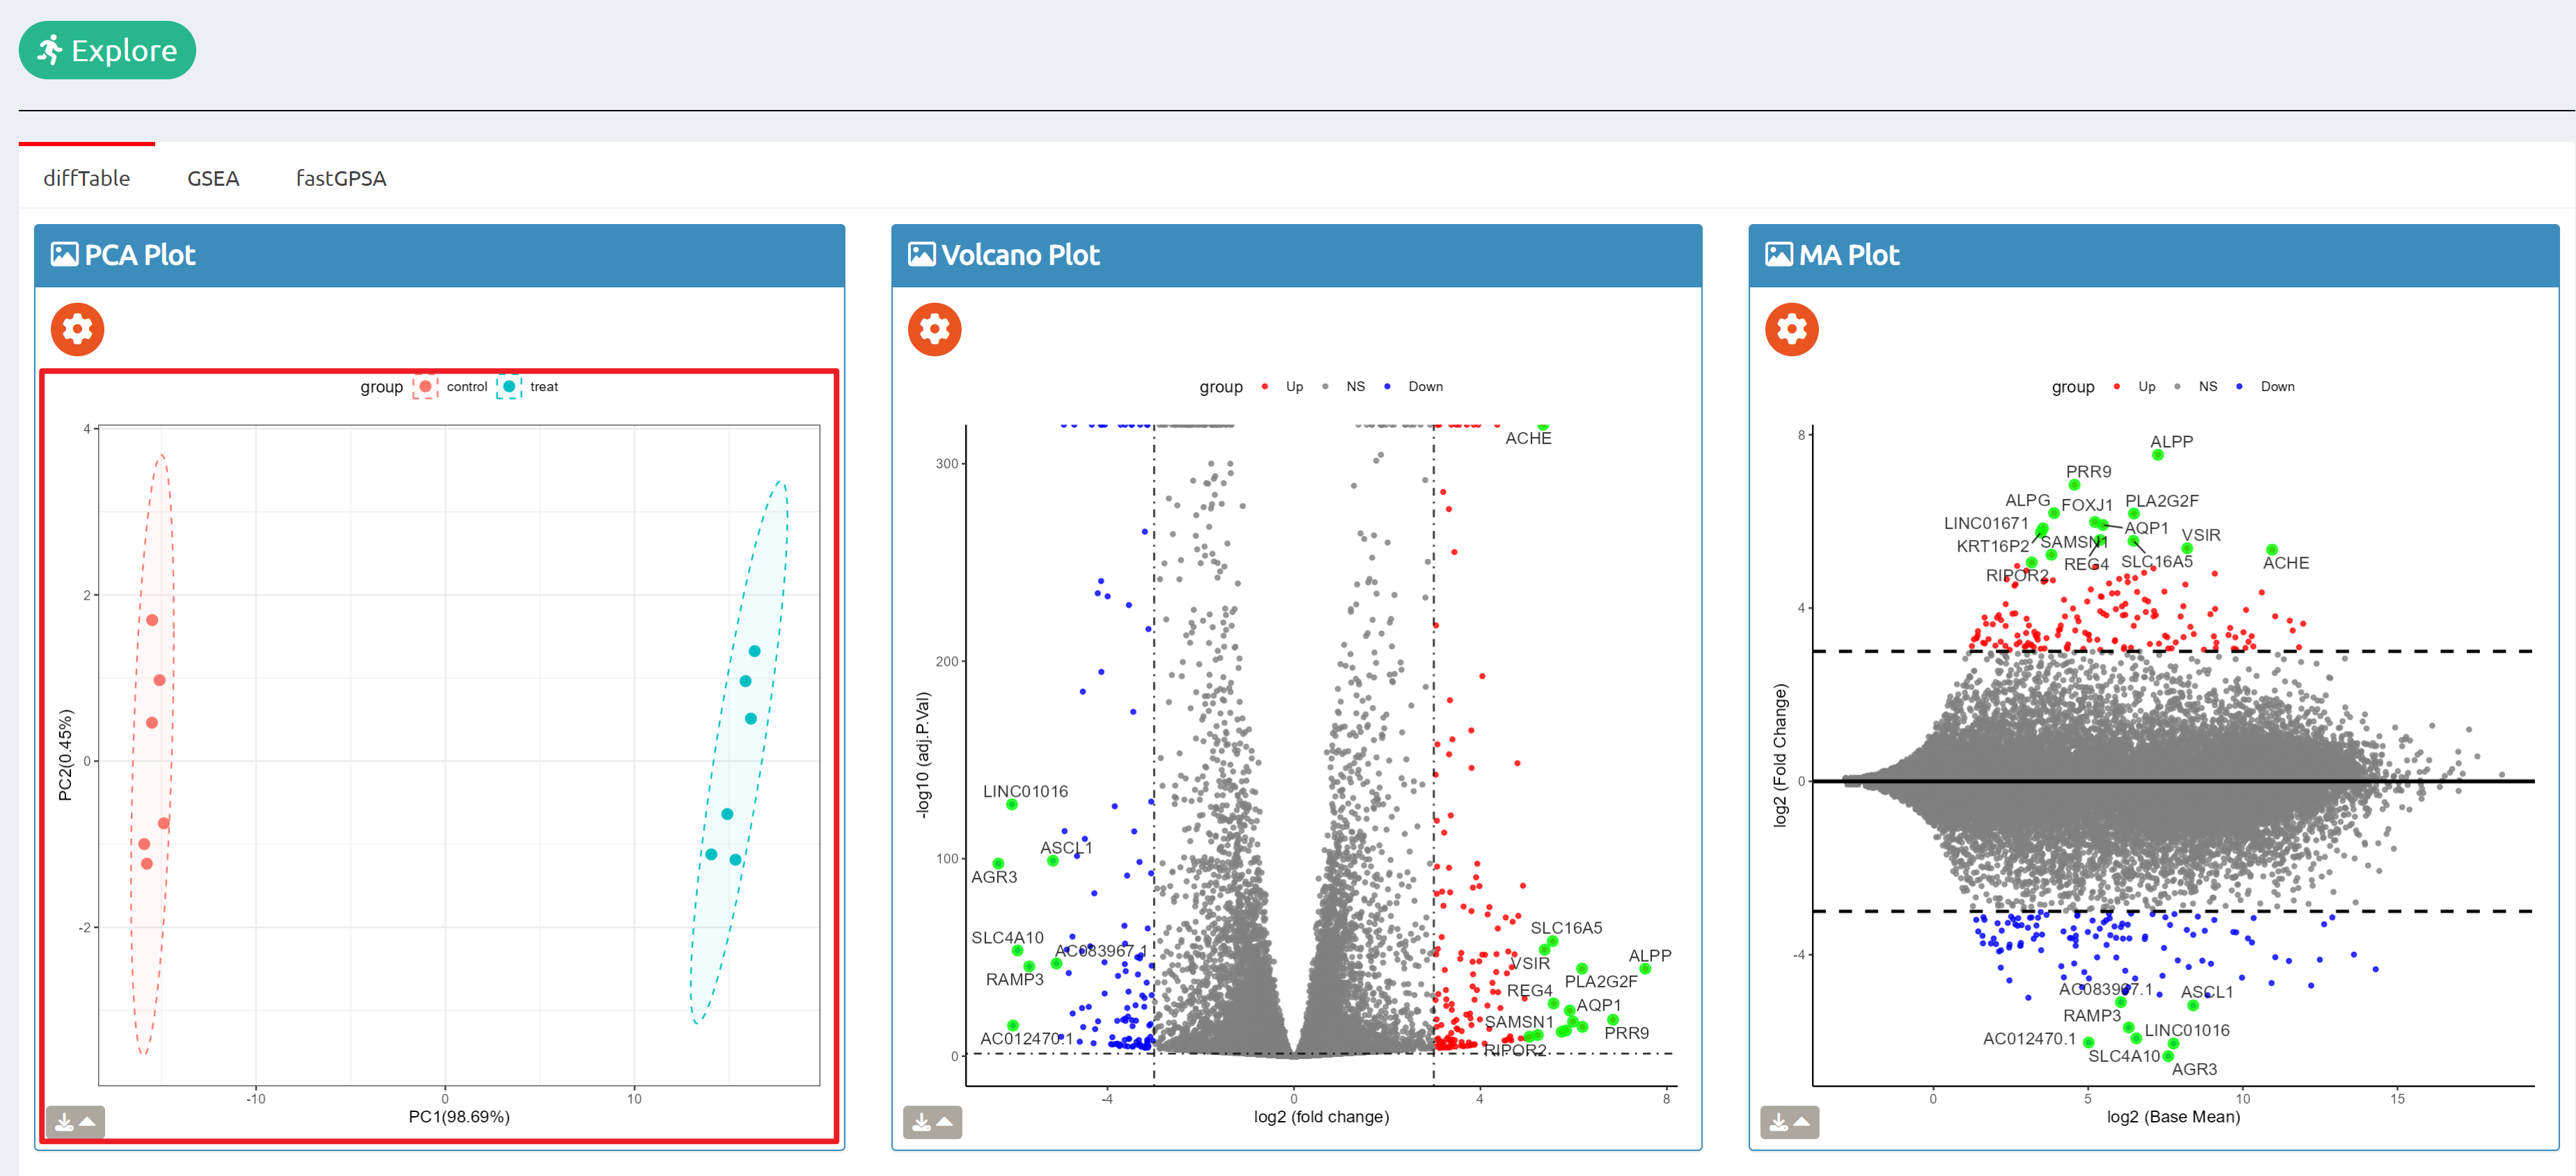
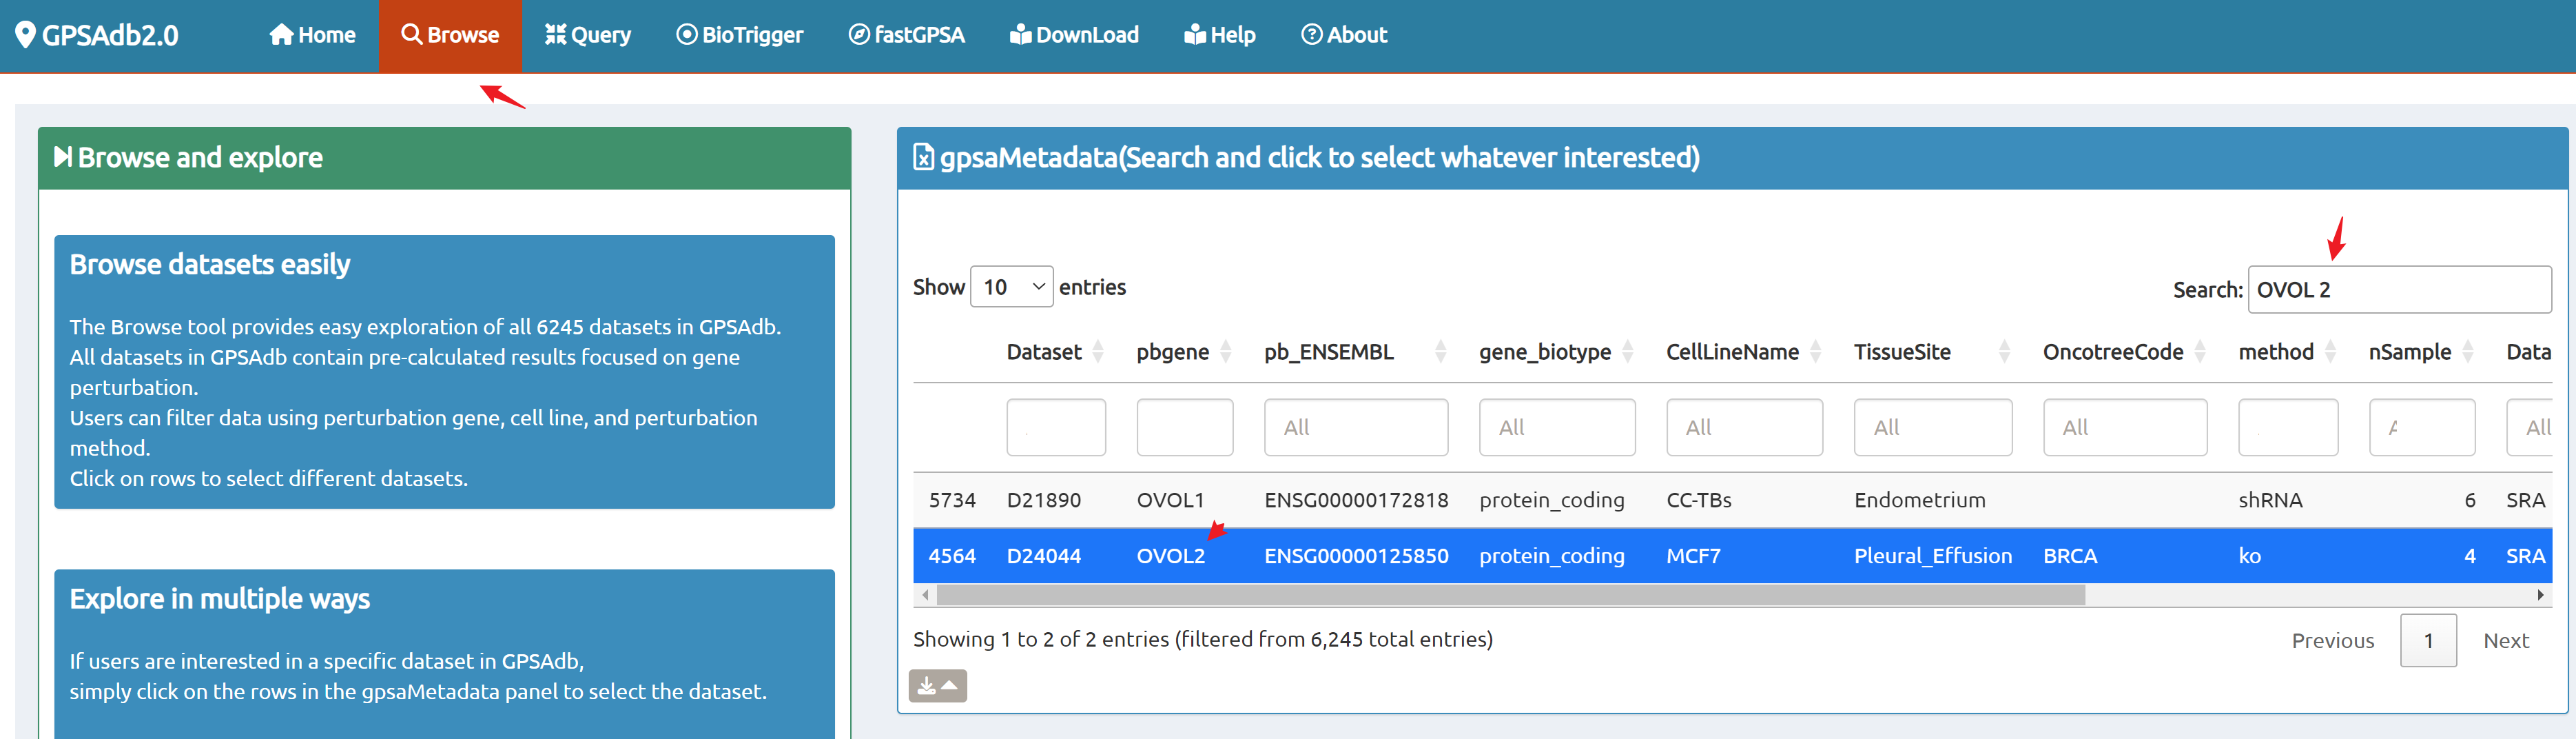
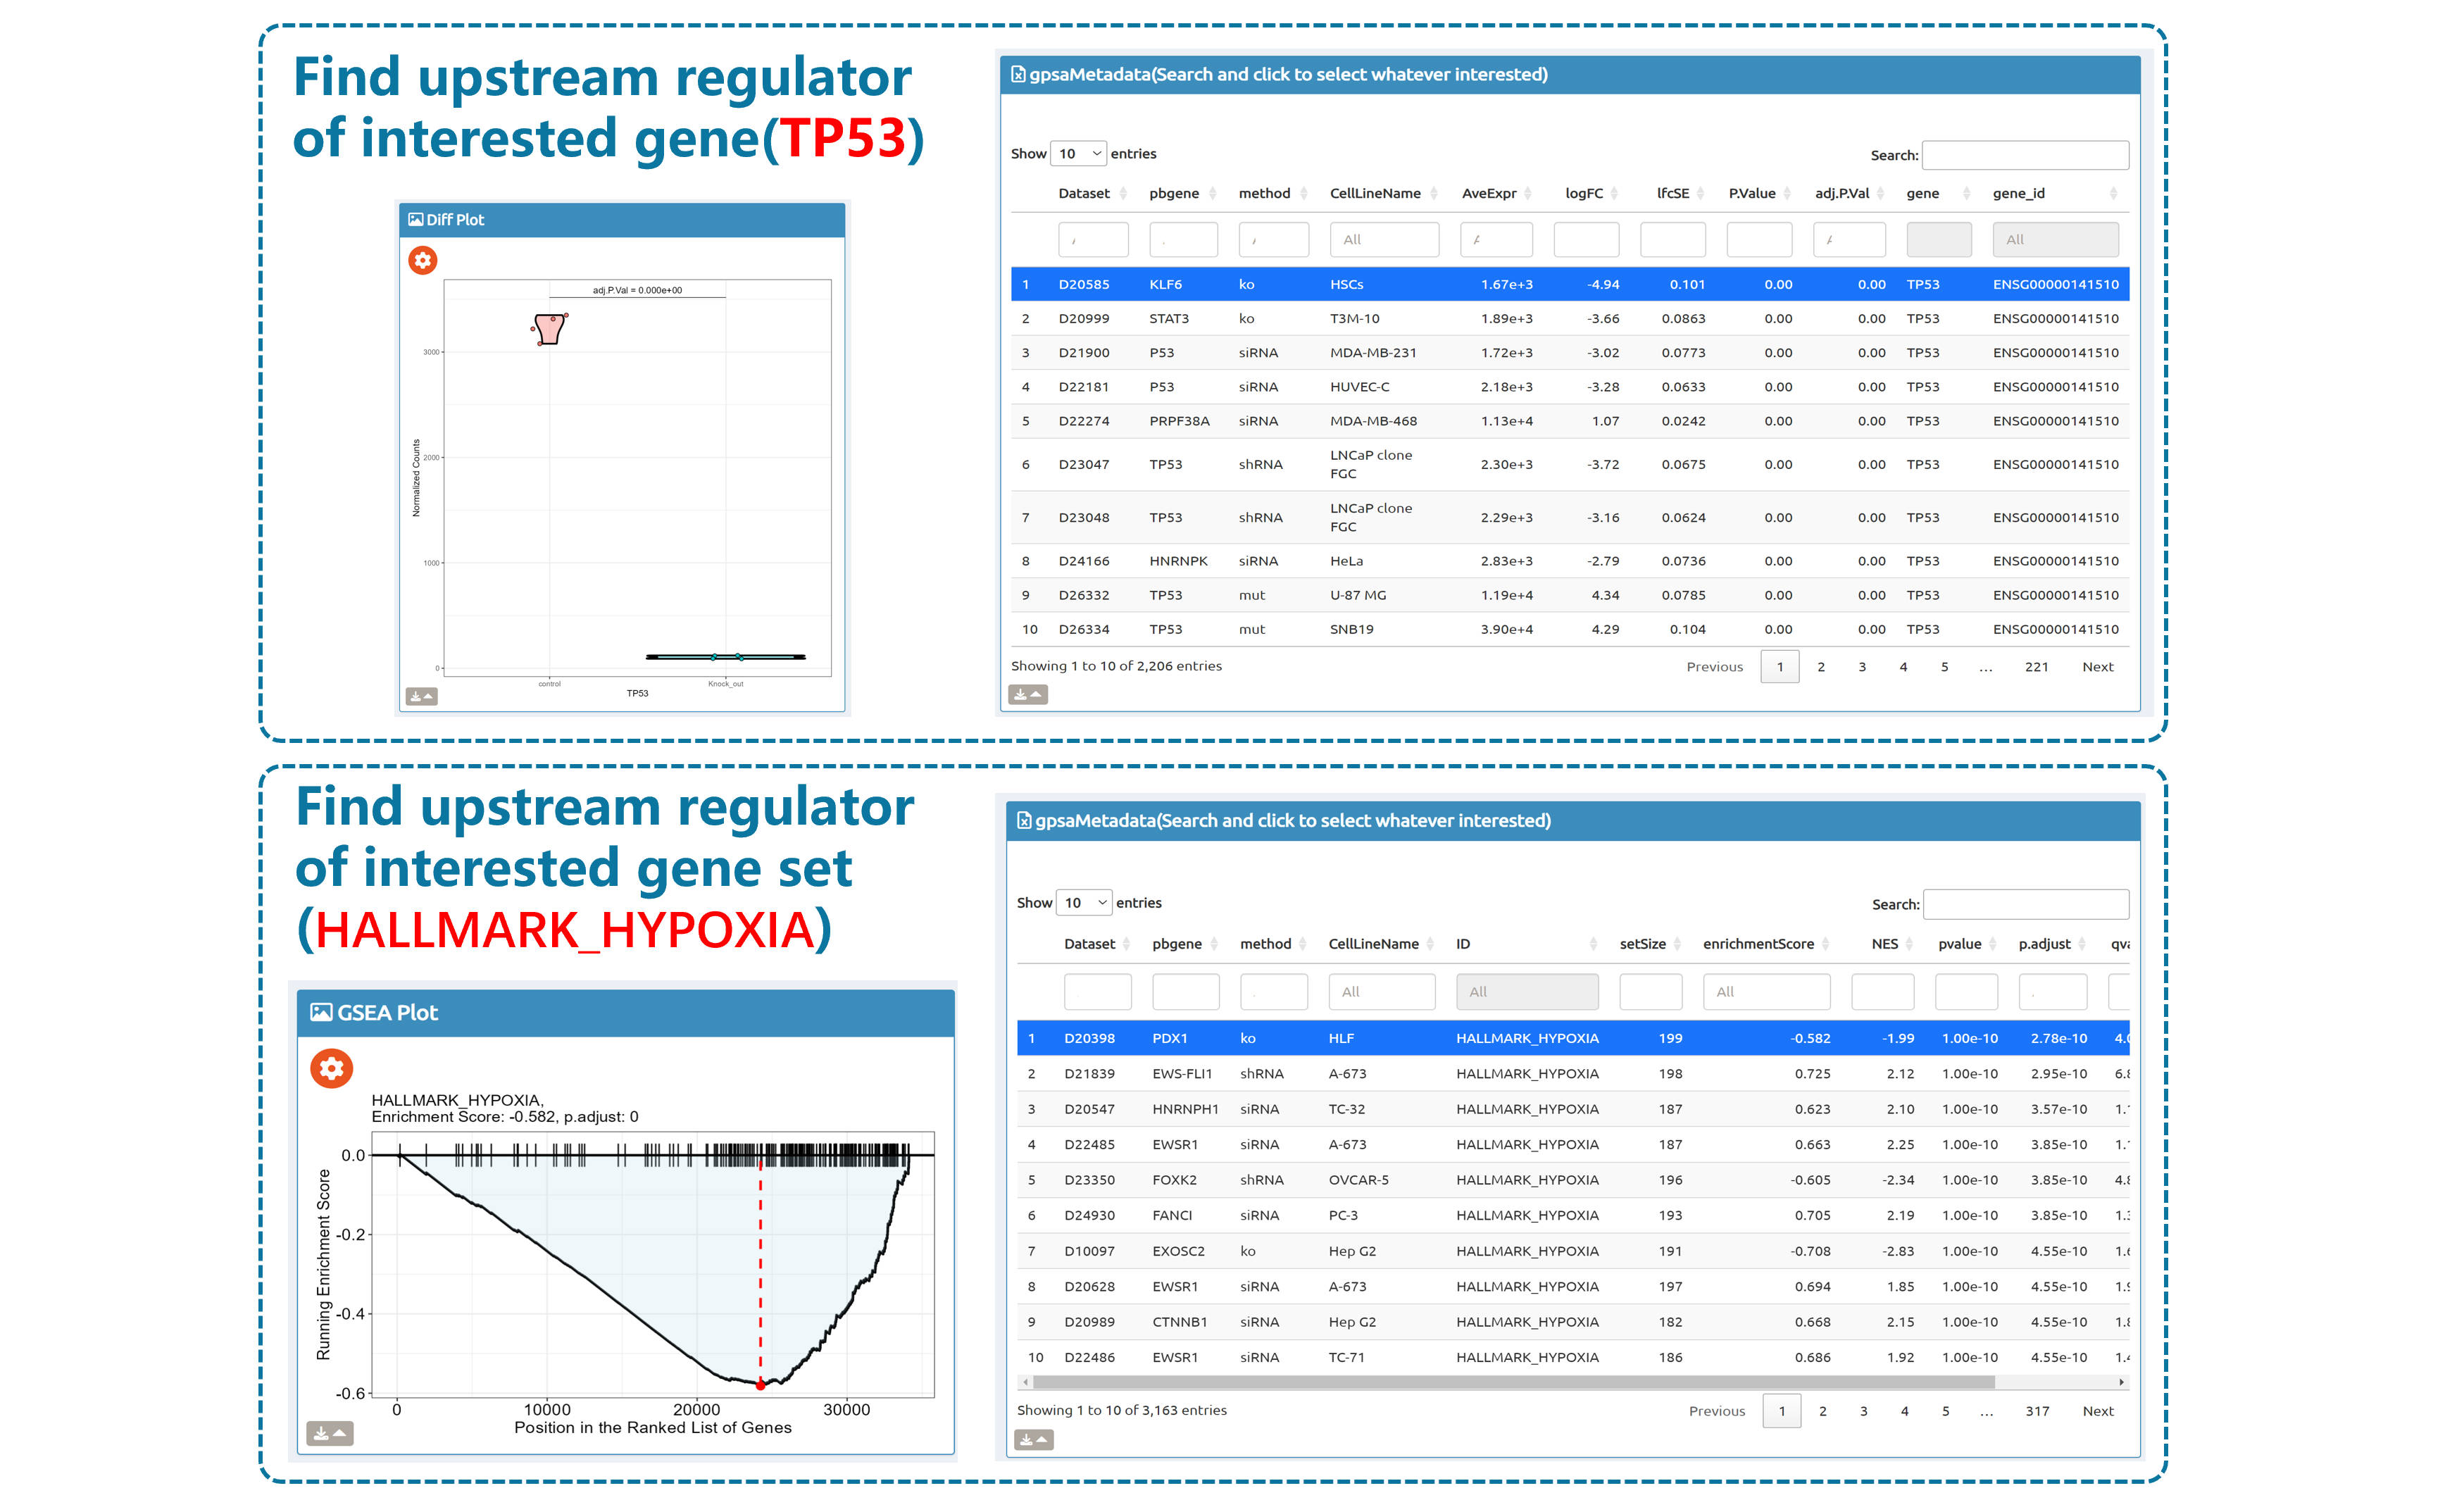
- Browse perturbation biology: Explore 15,330 perturbation gene sets and drill down by gene, cell line, or pathway.
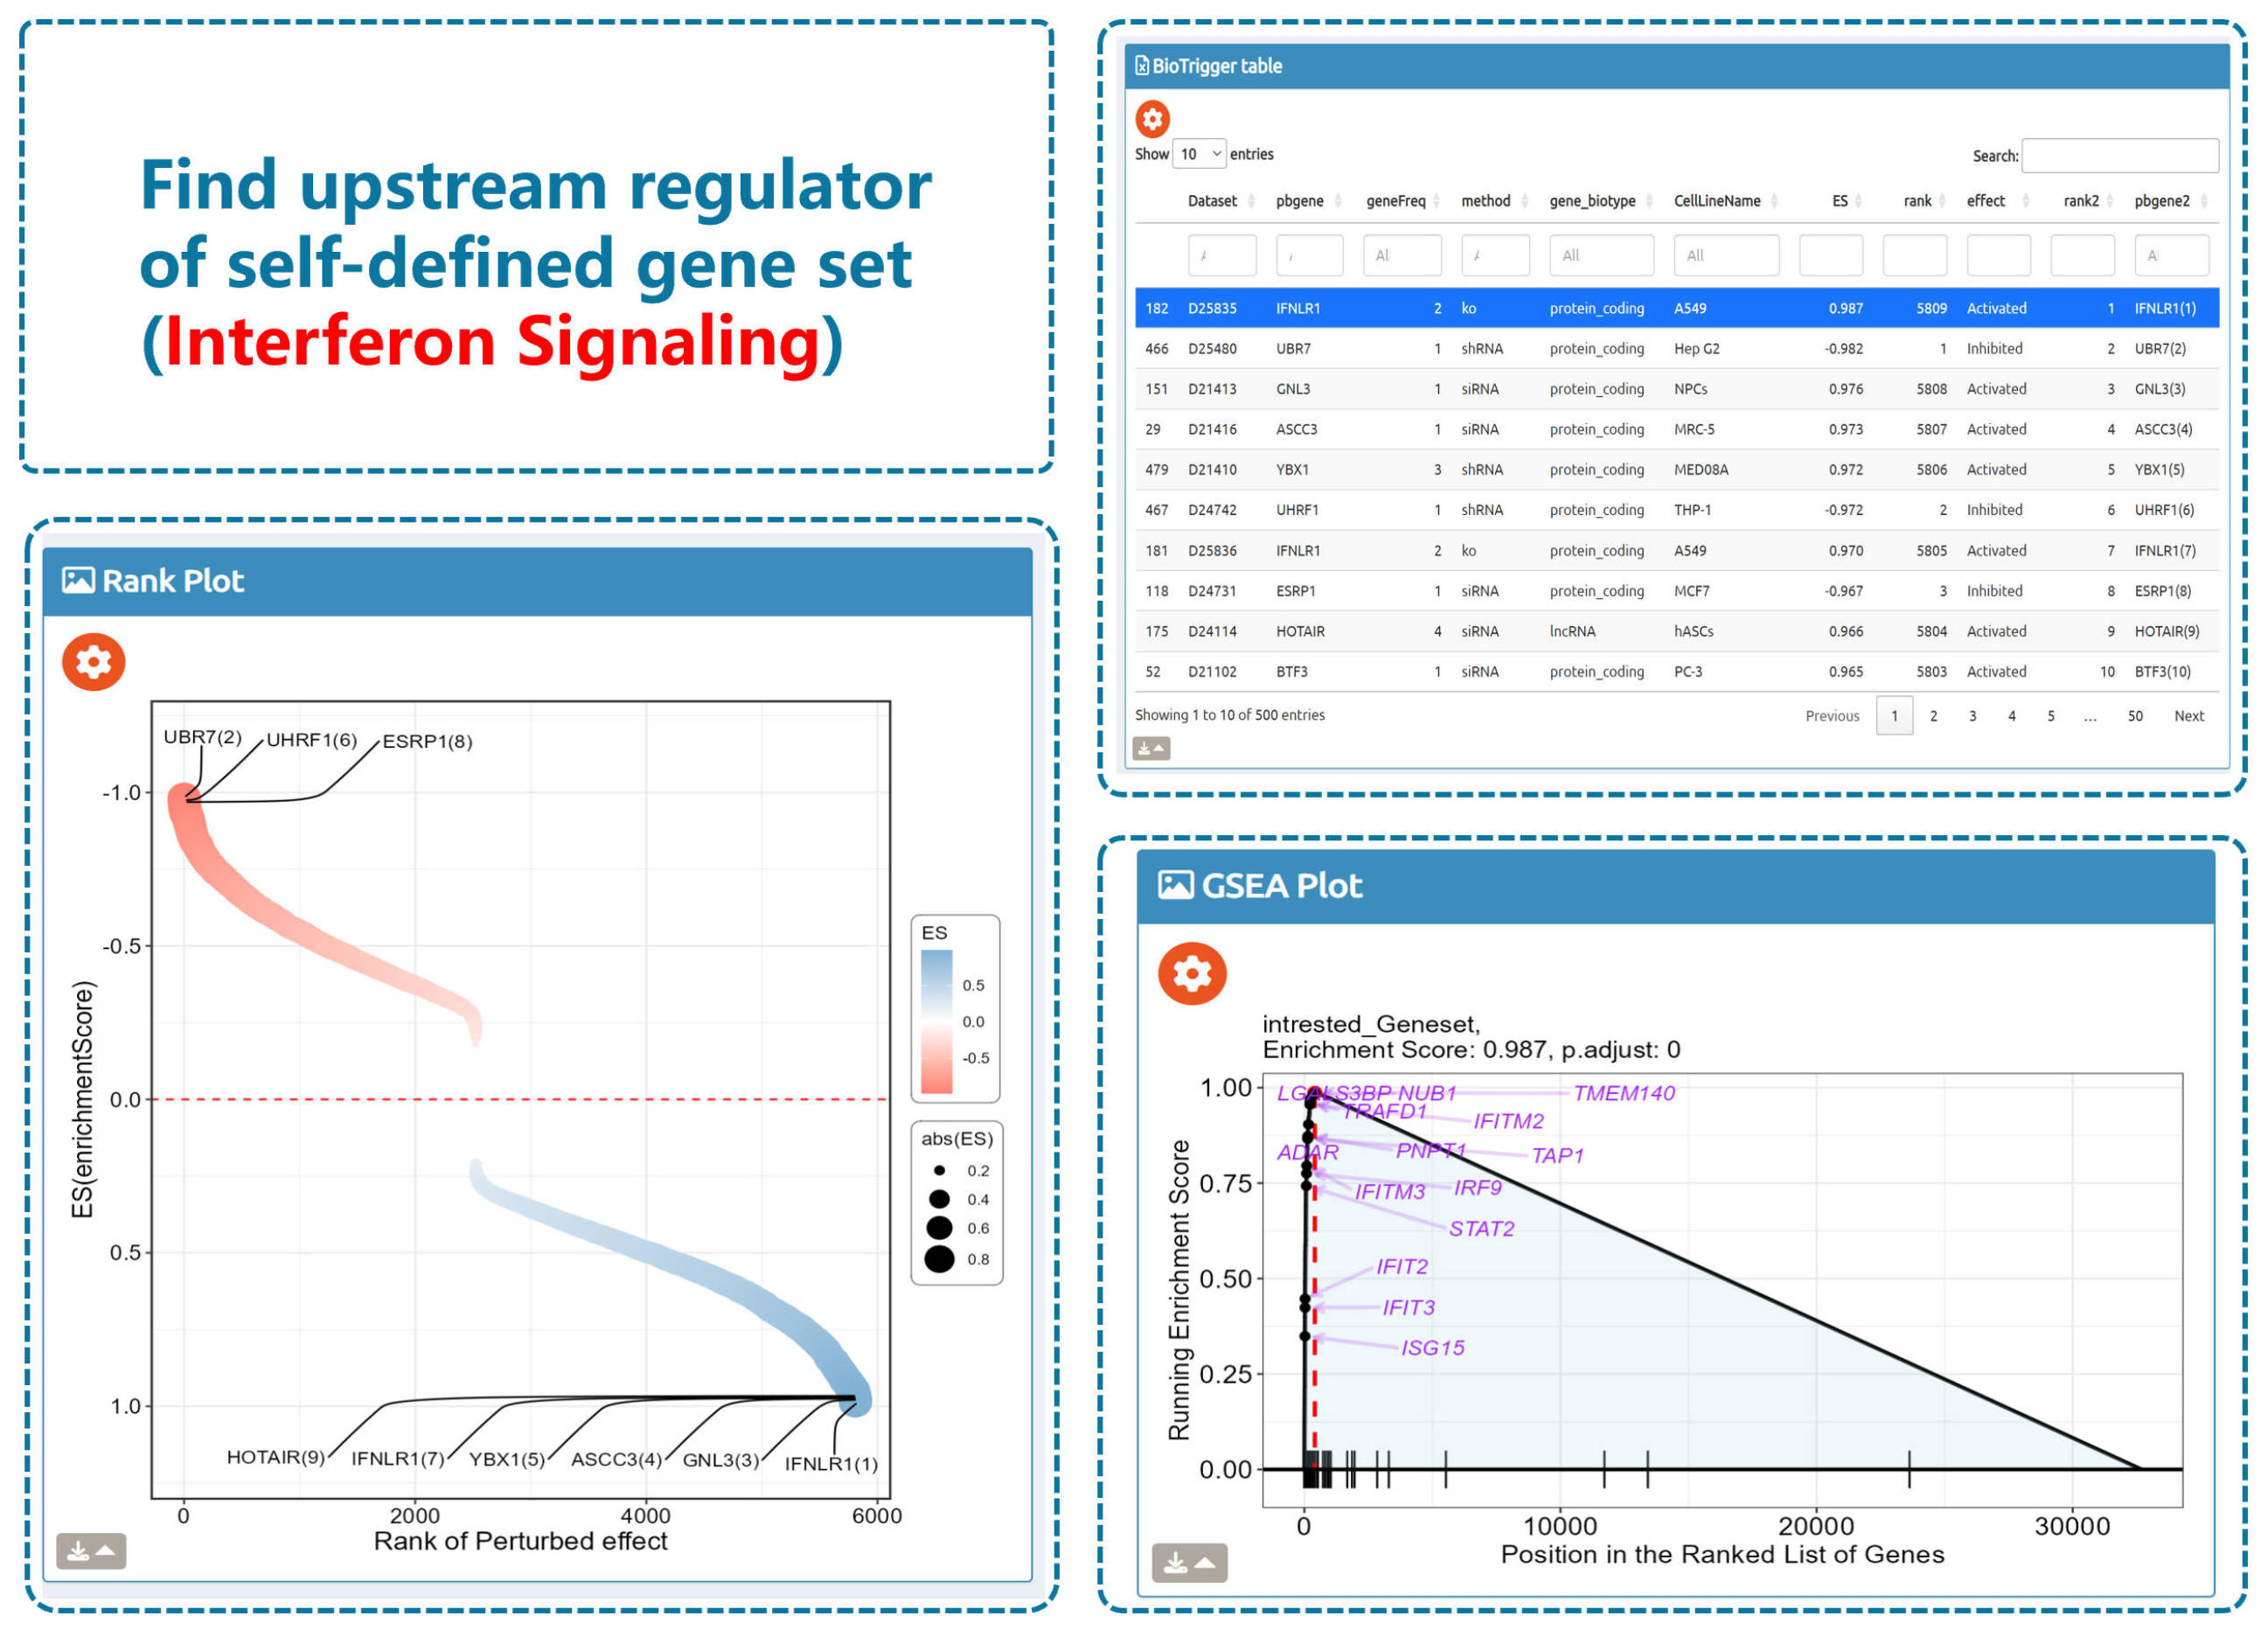
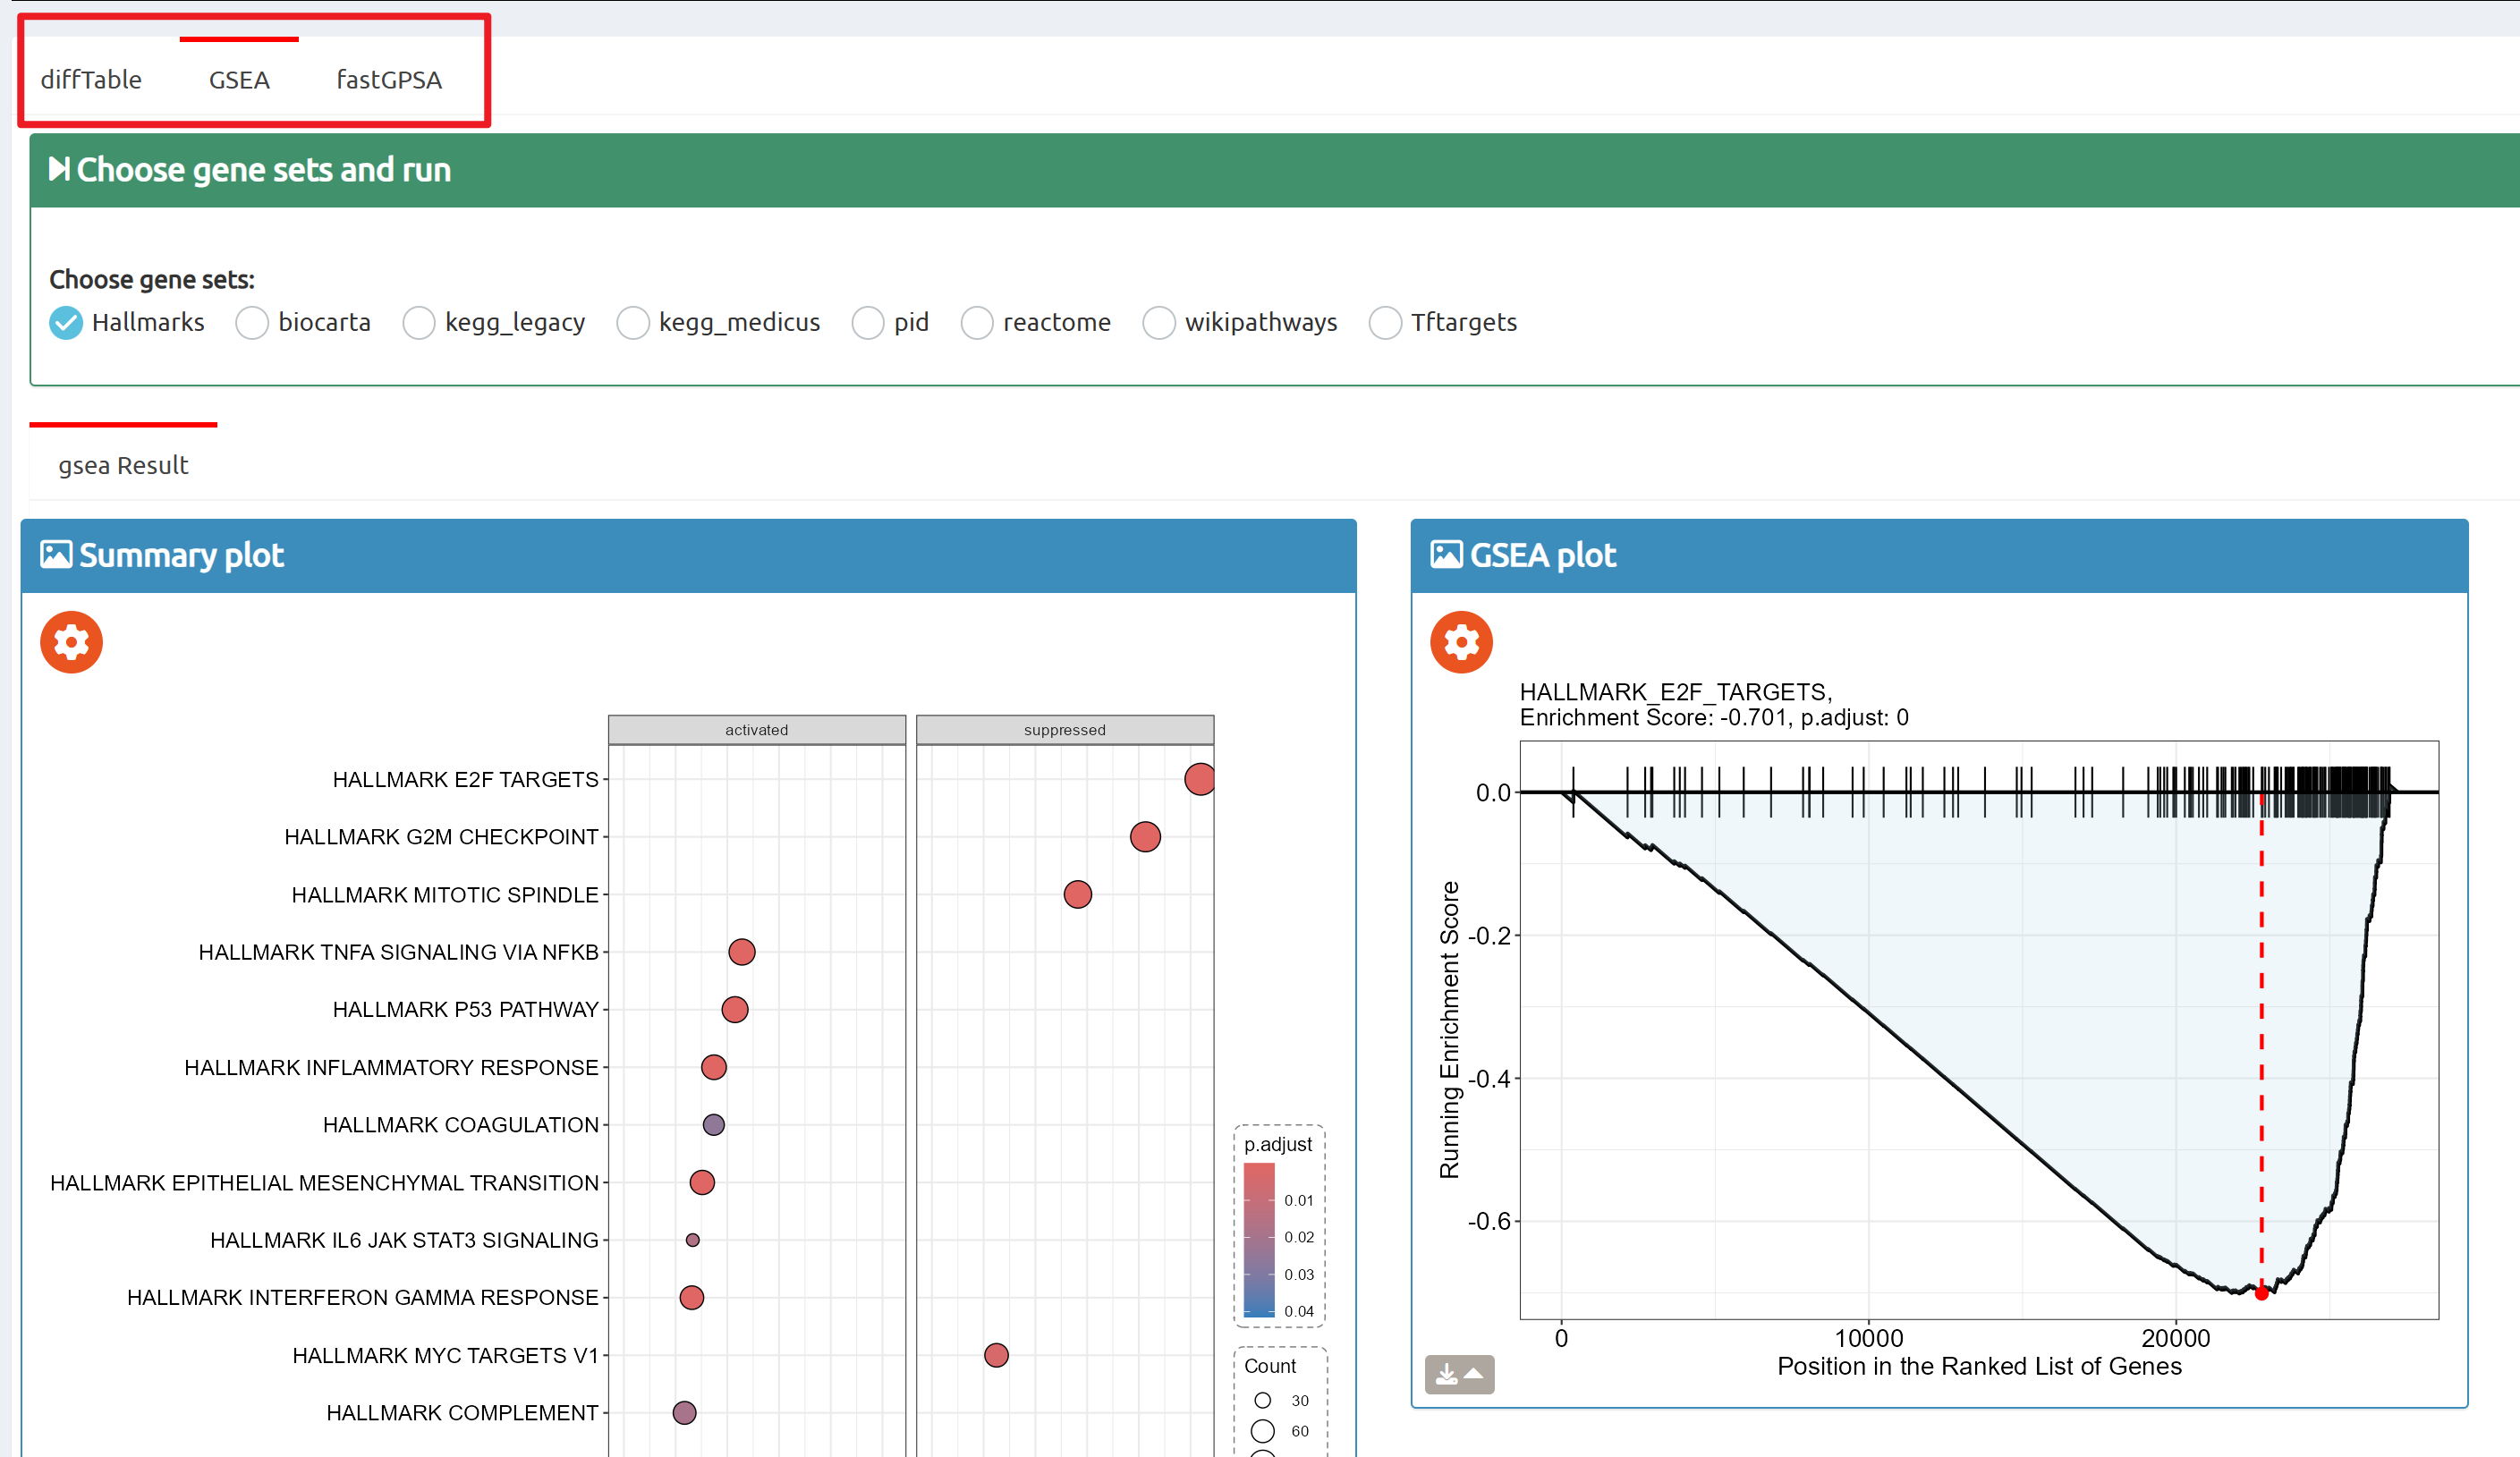
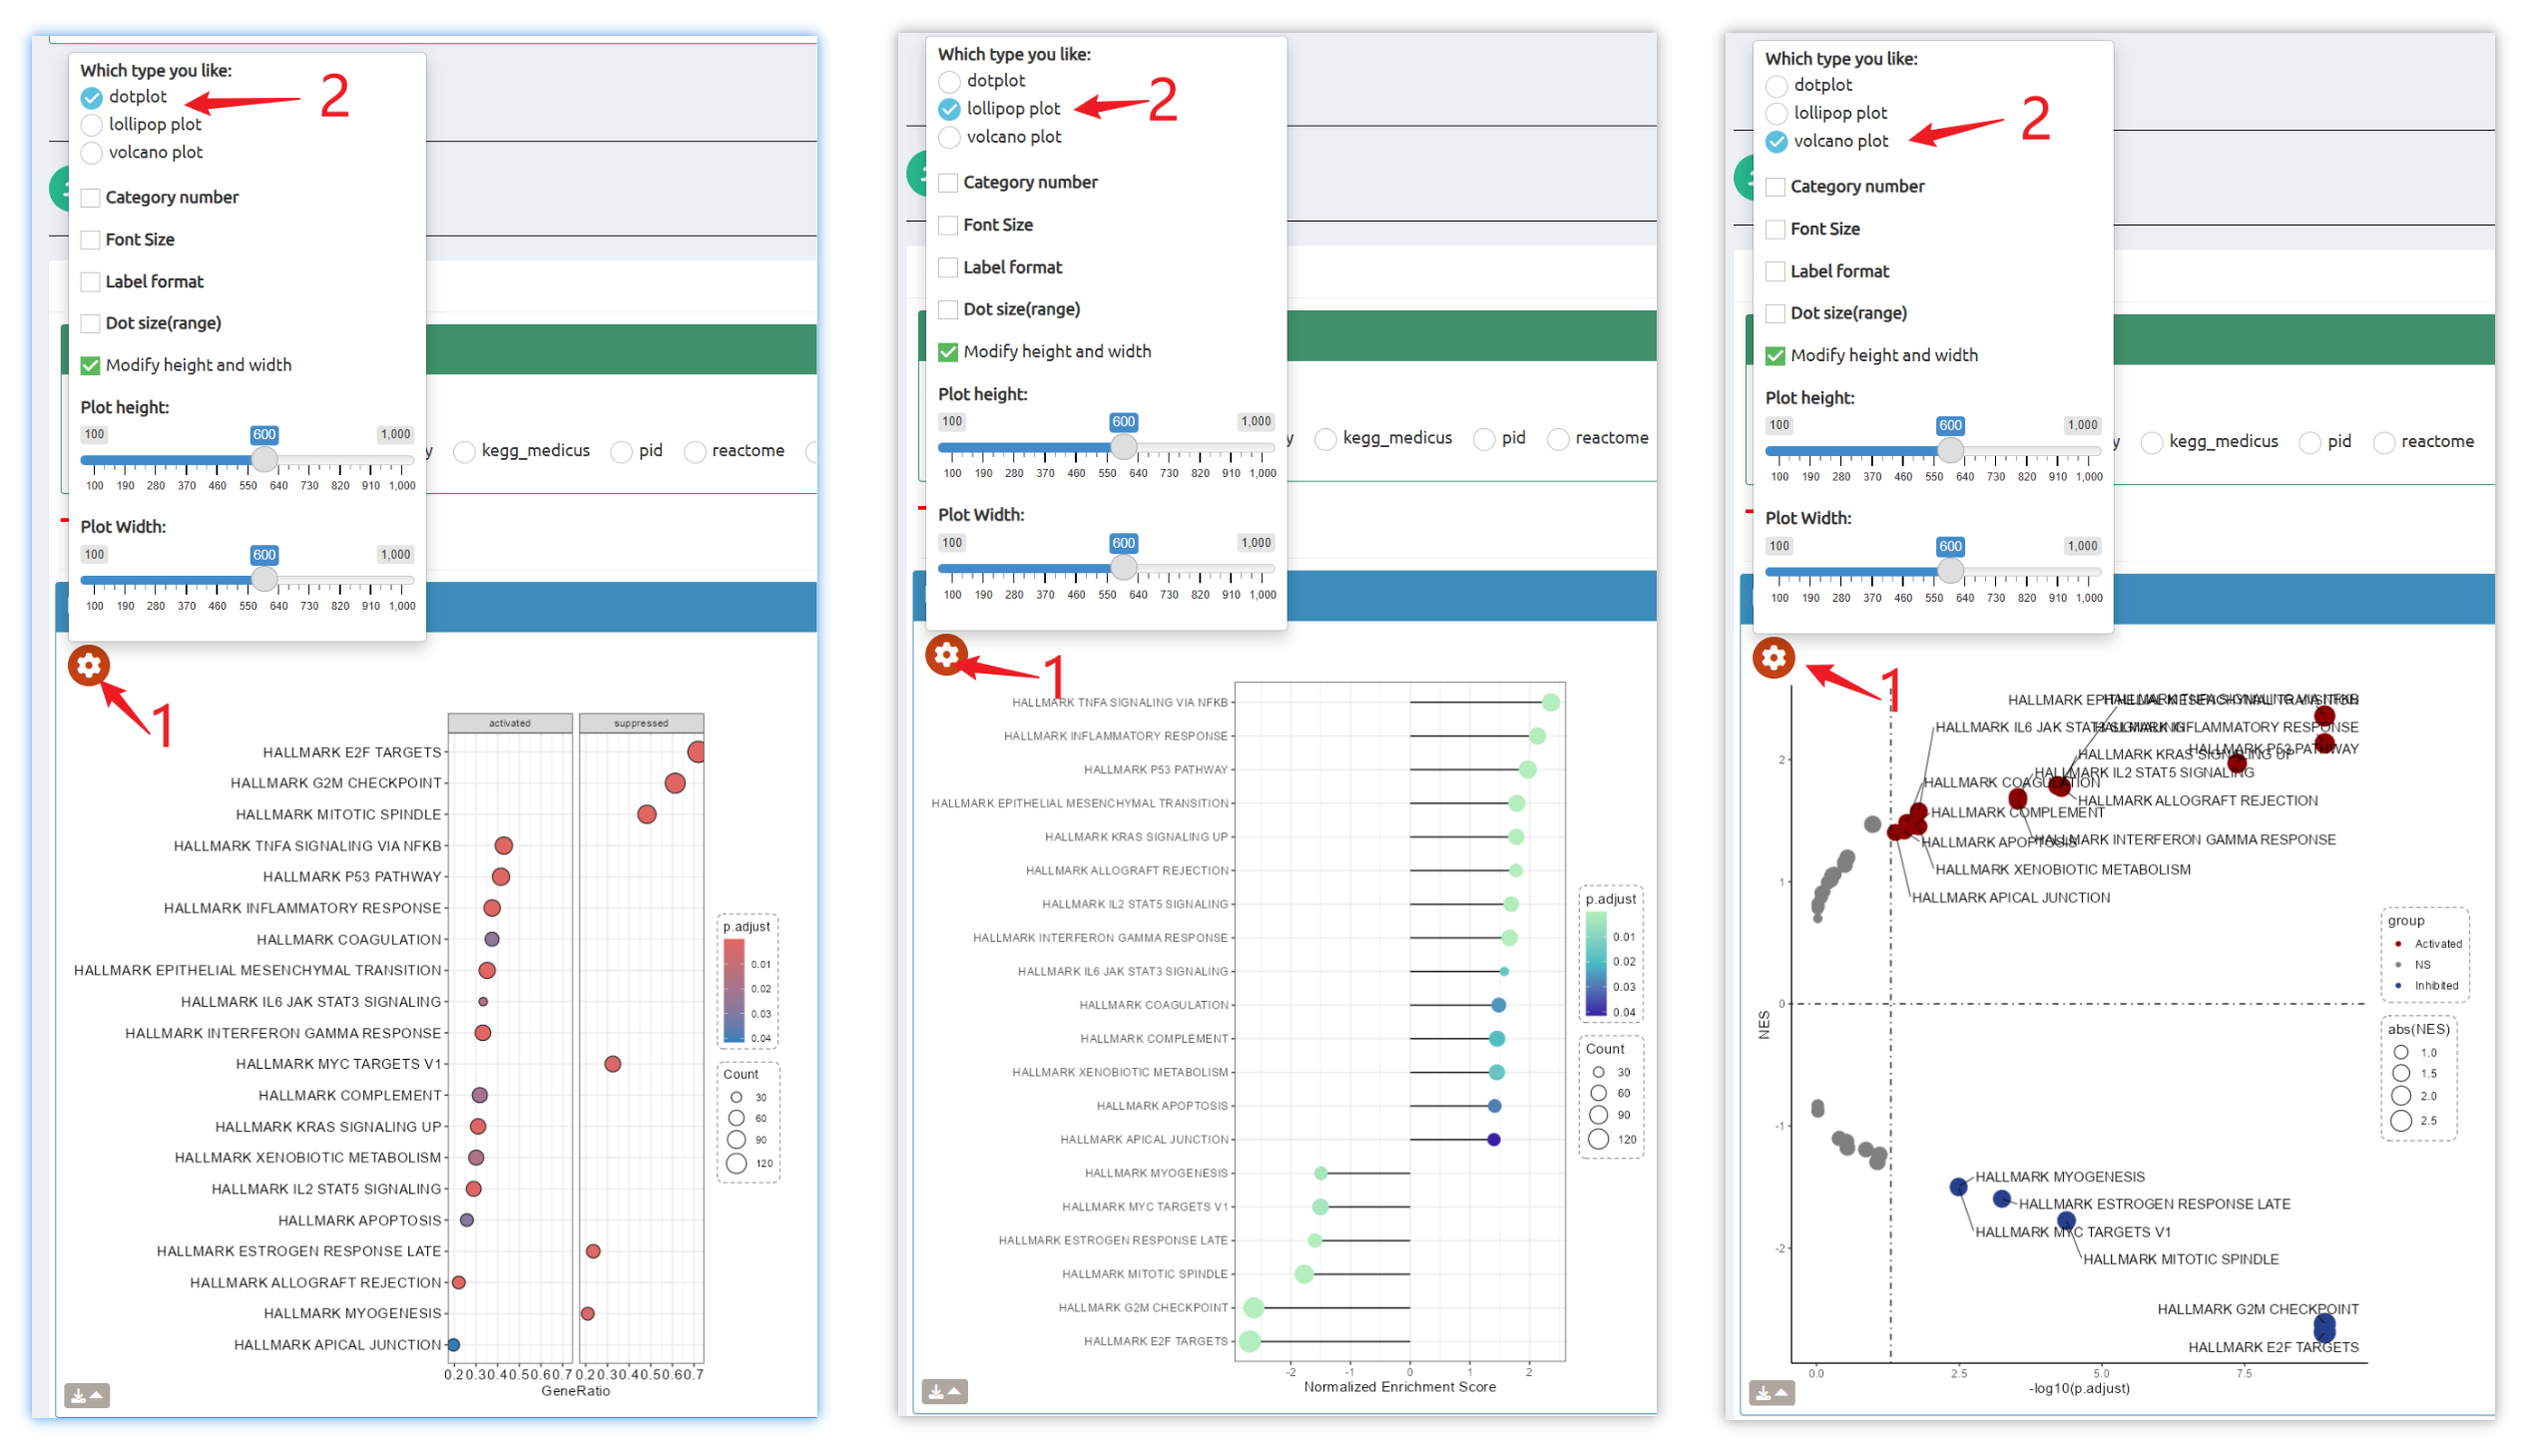
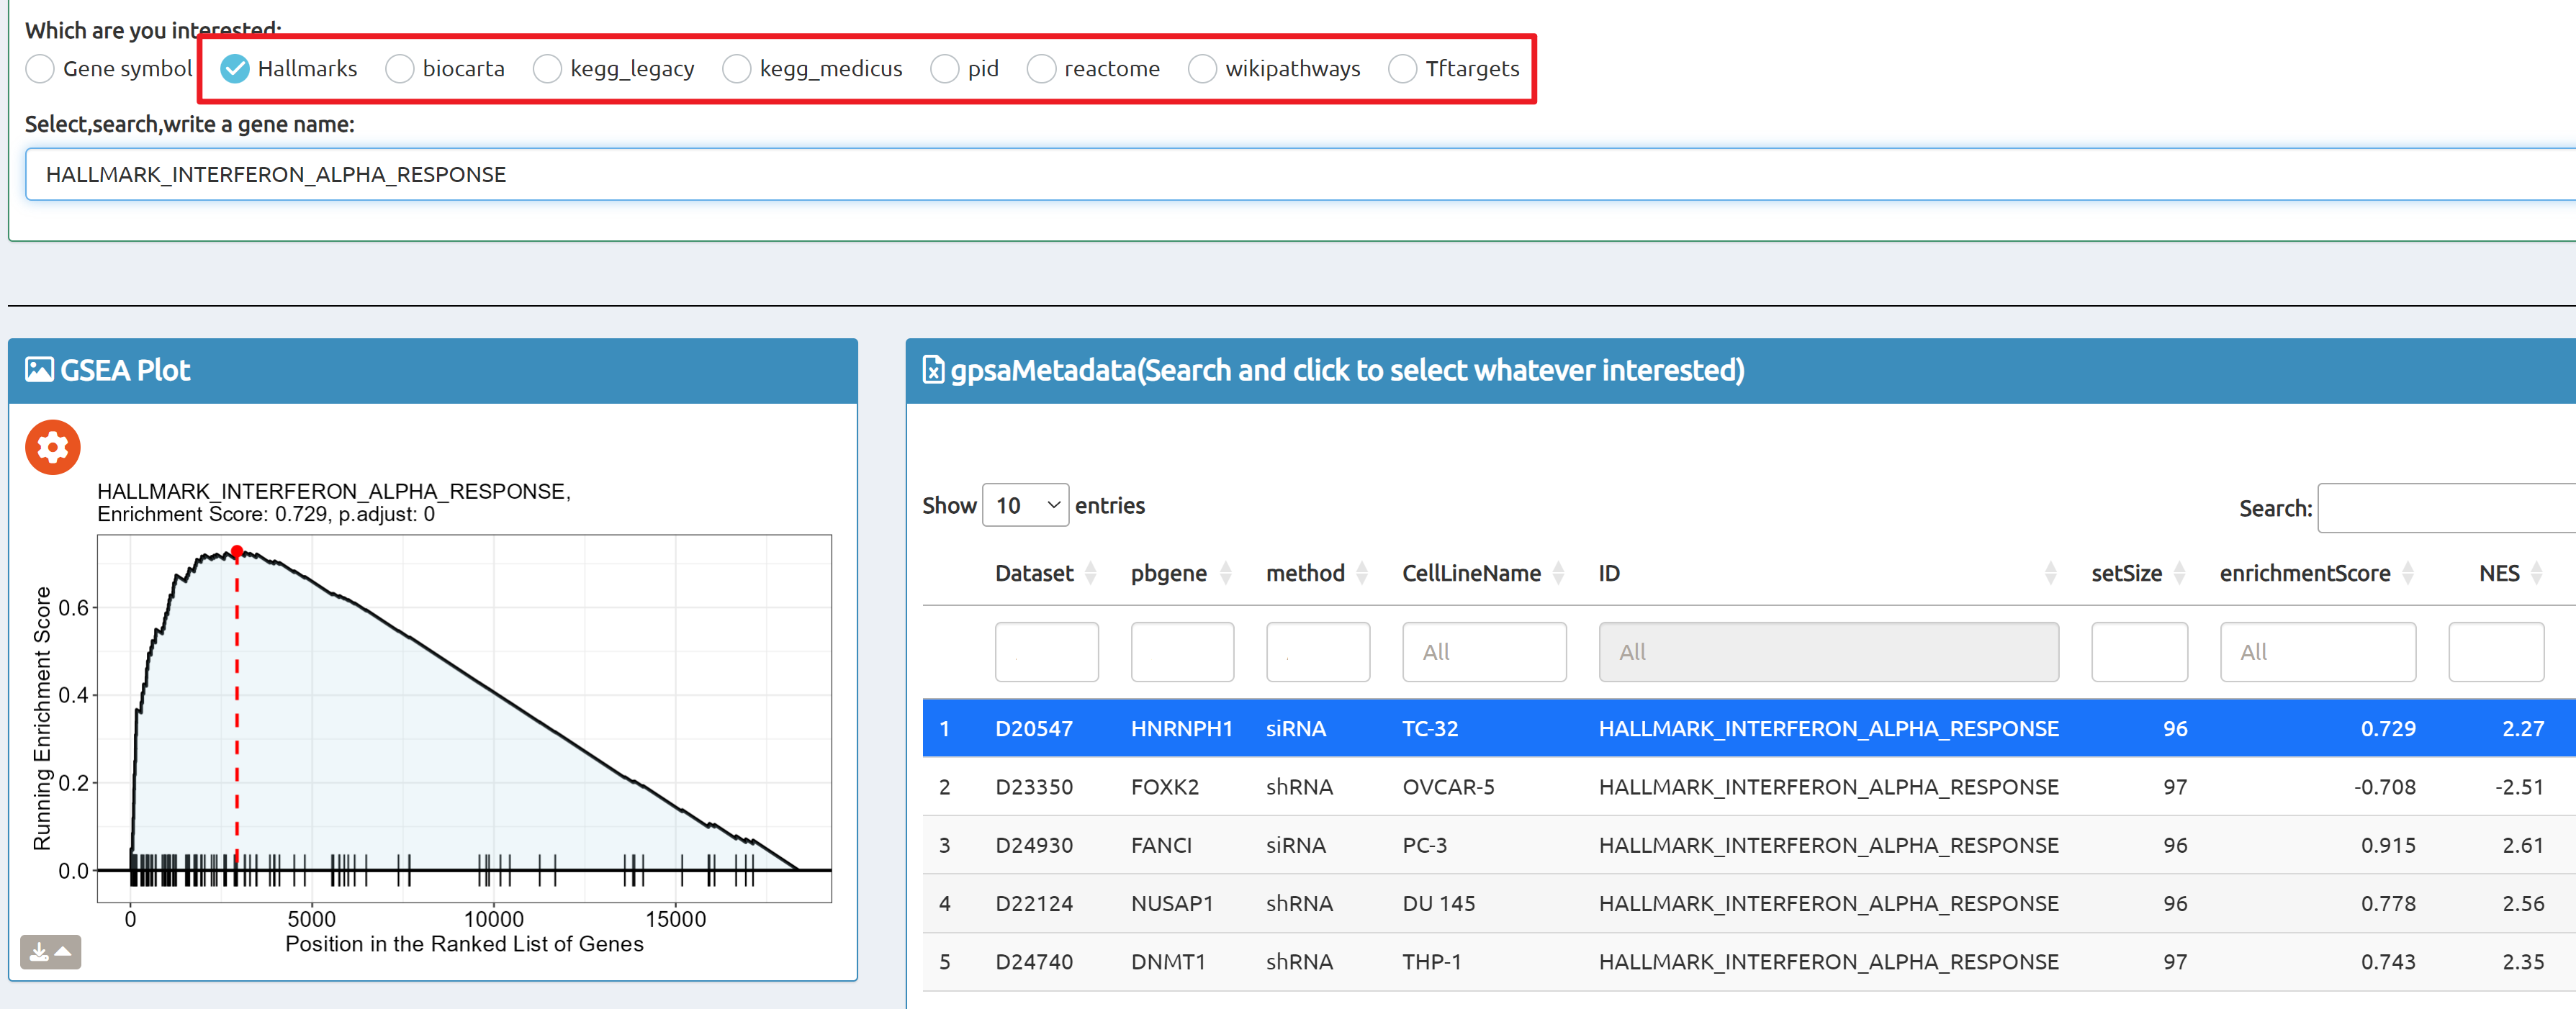
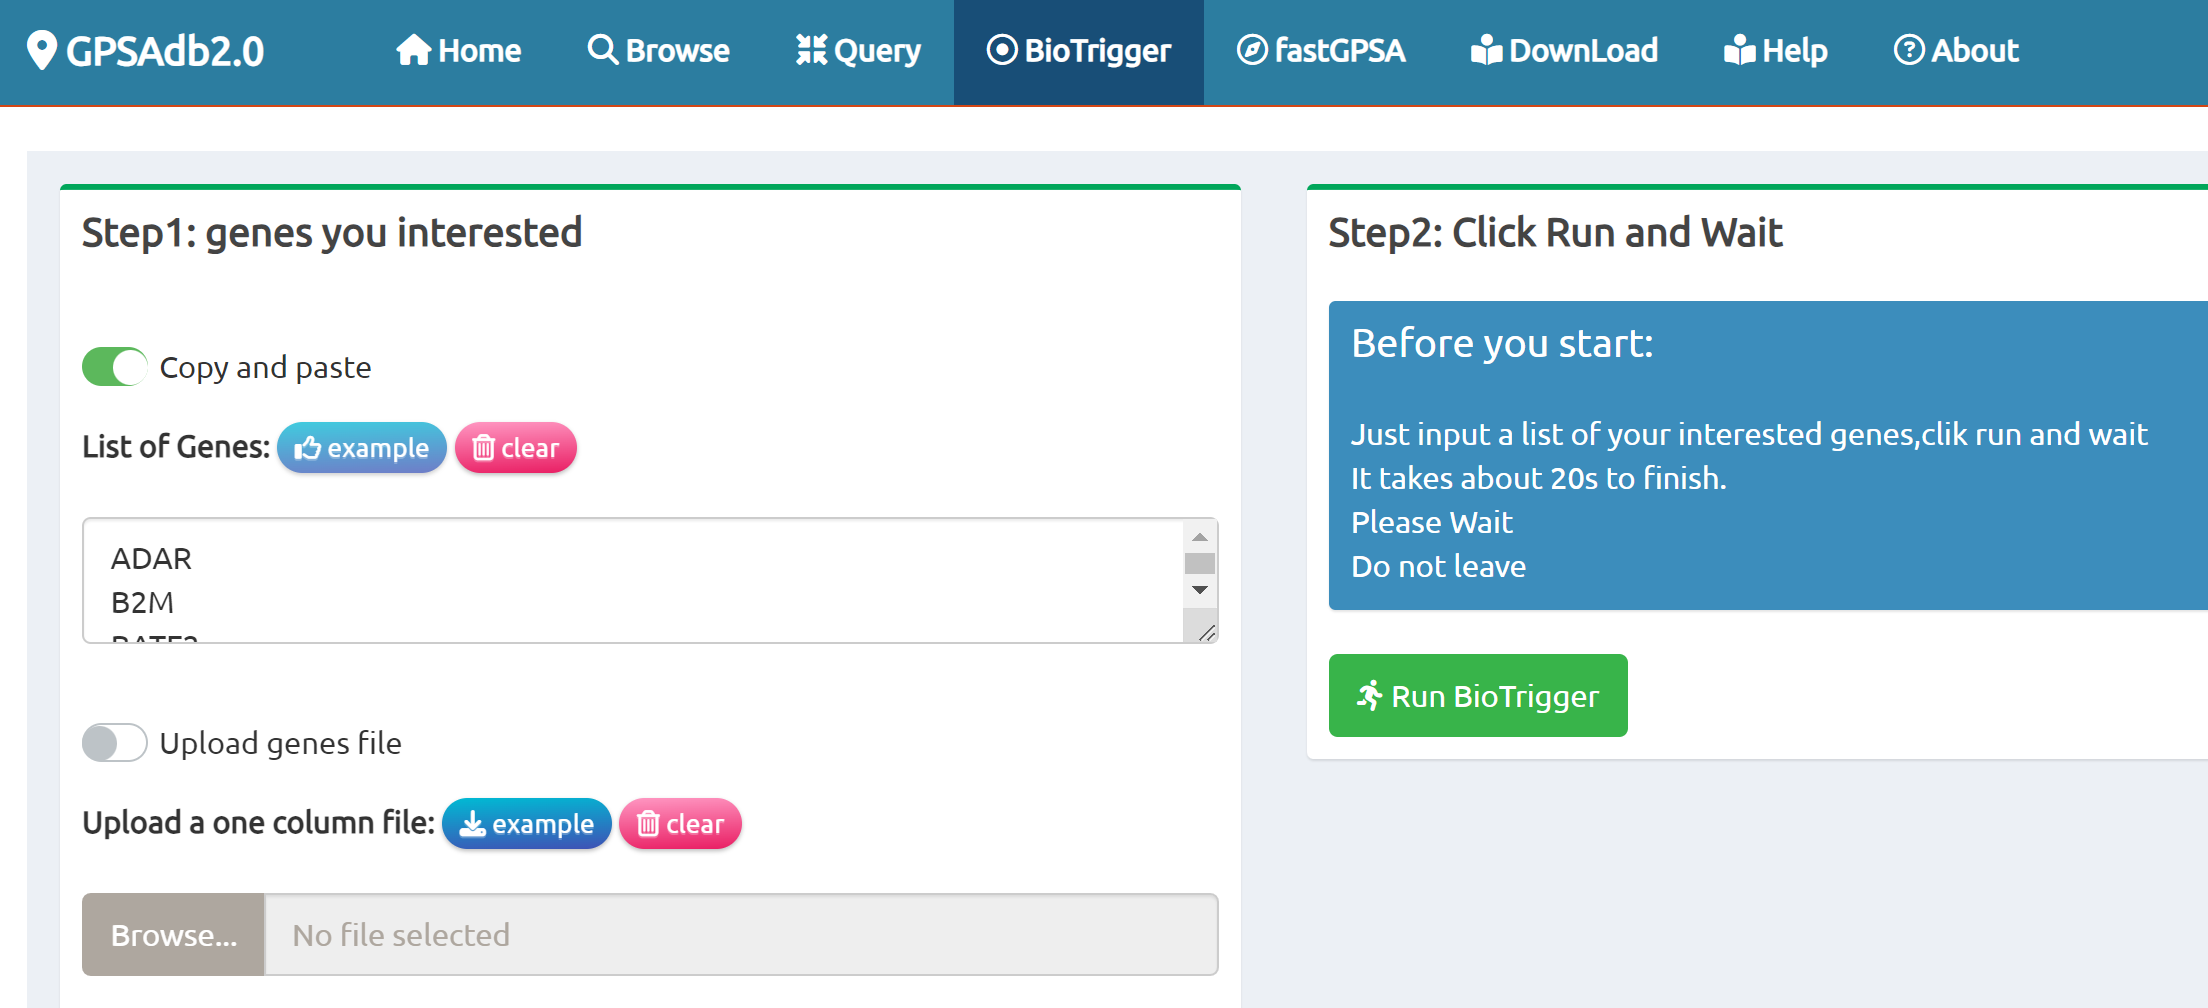
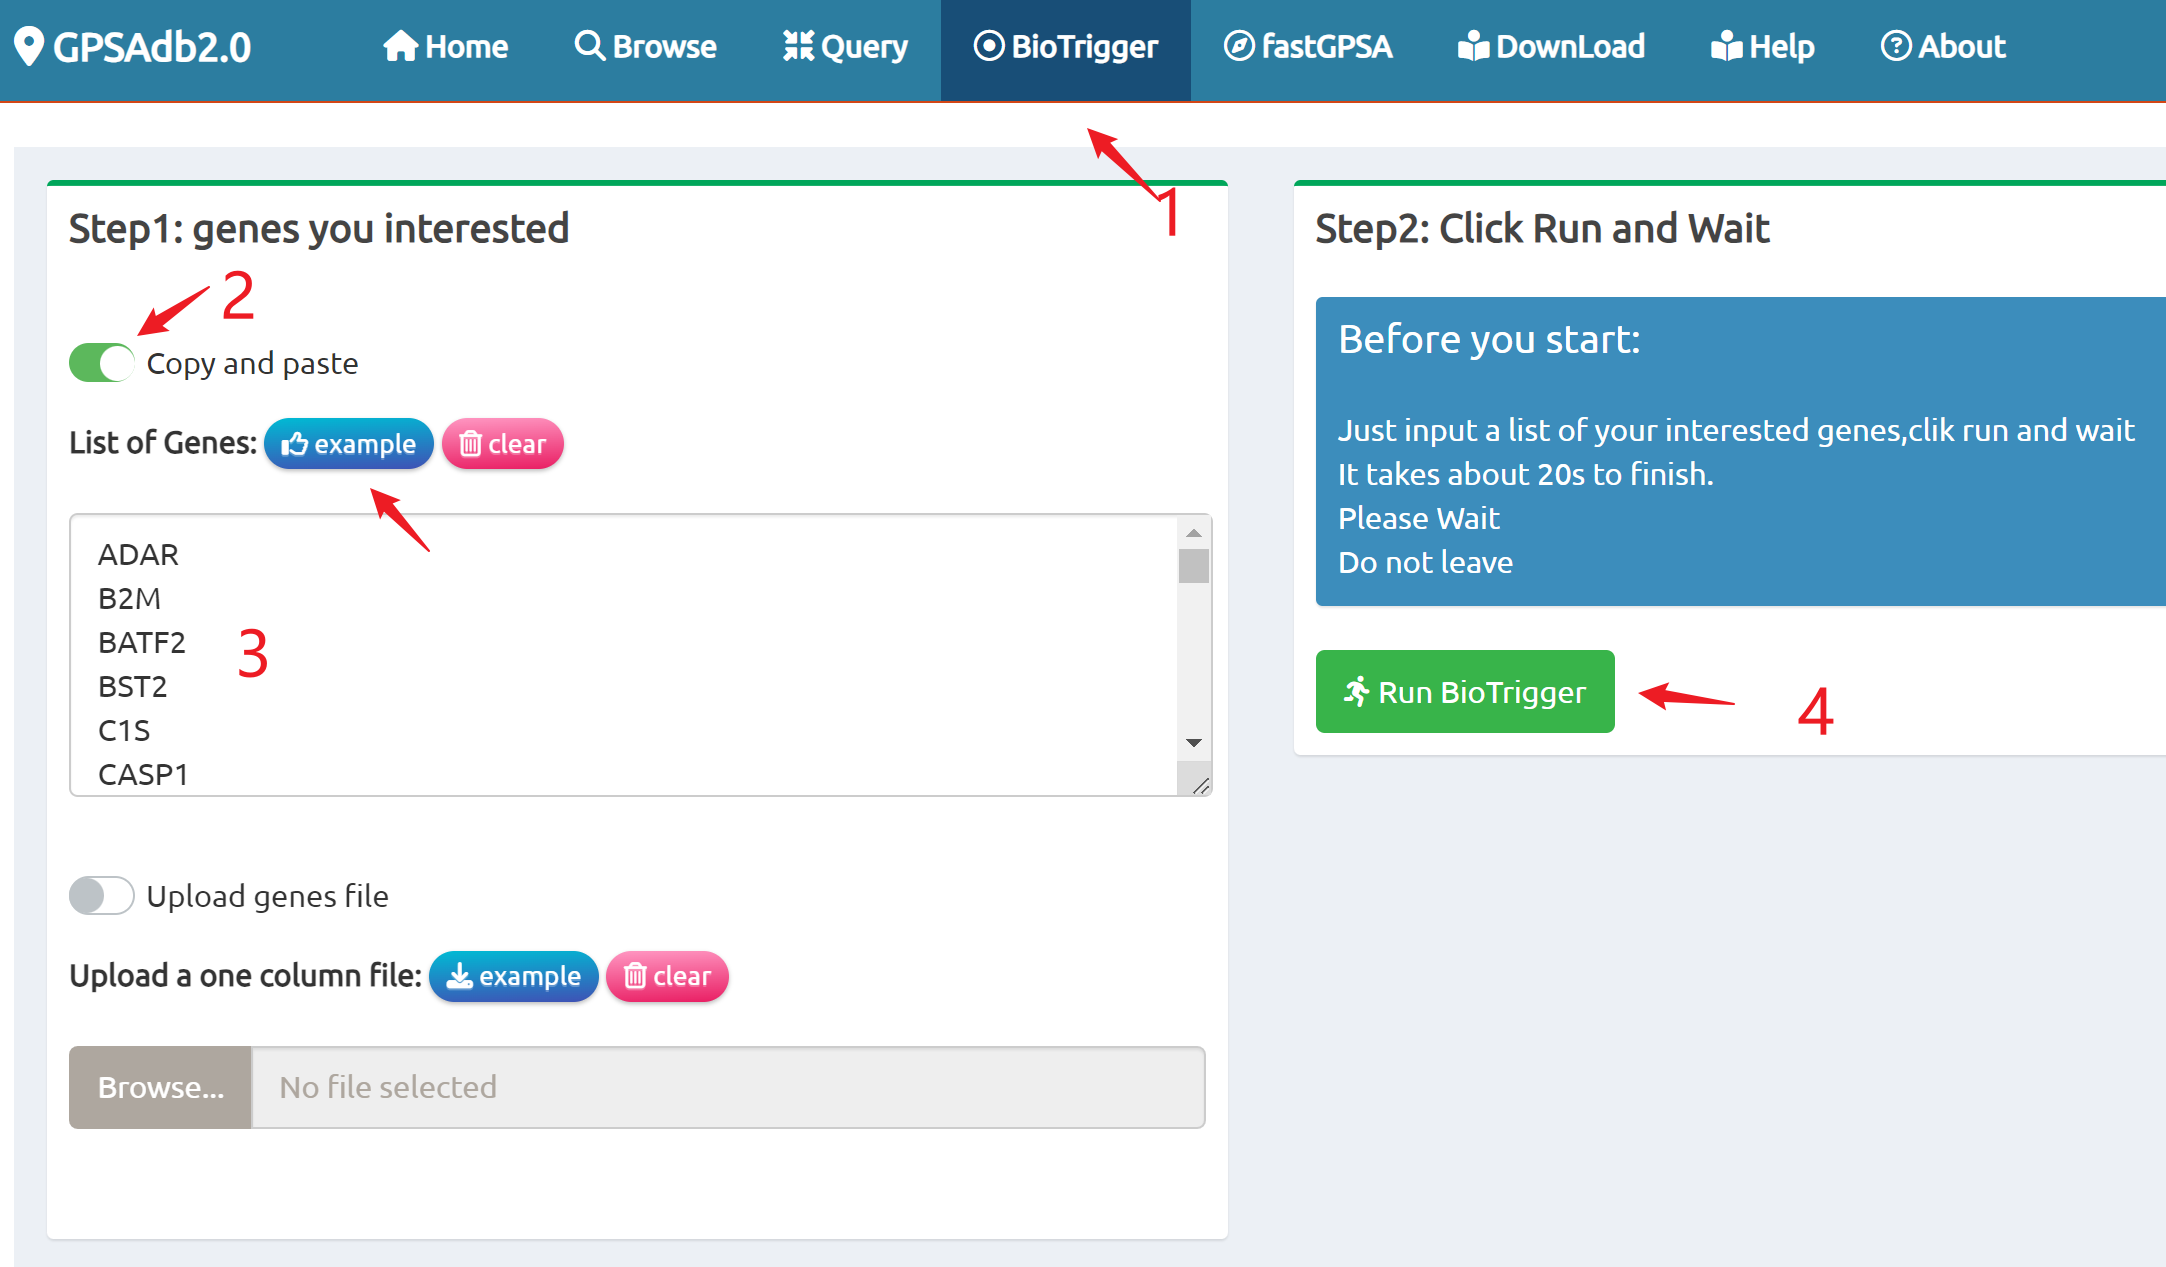
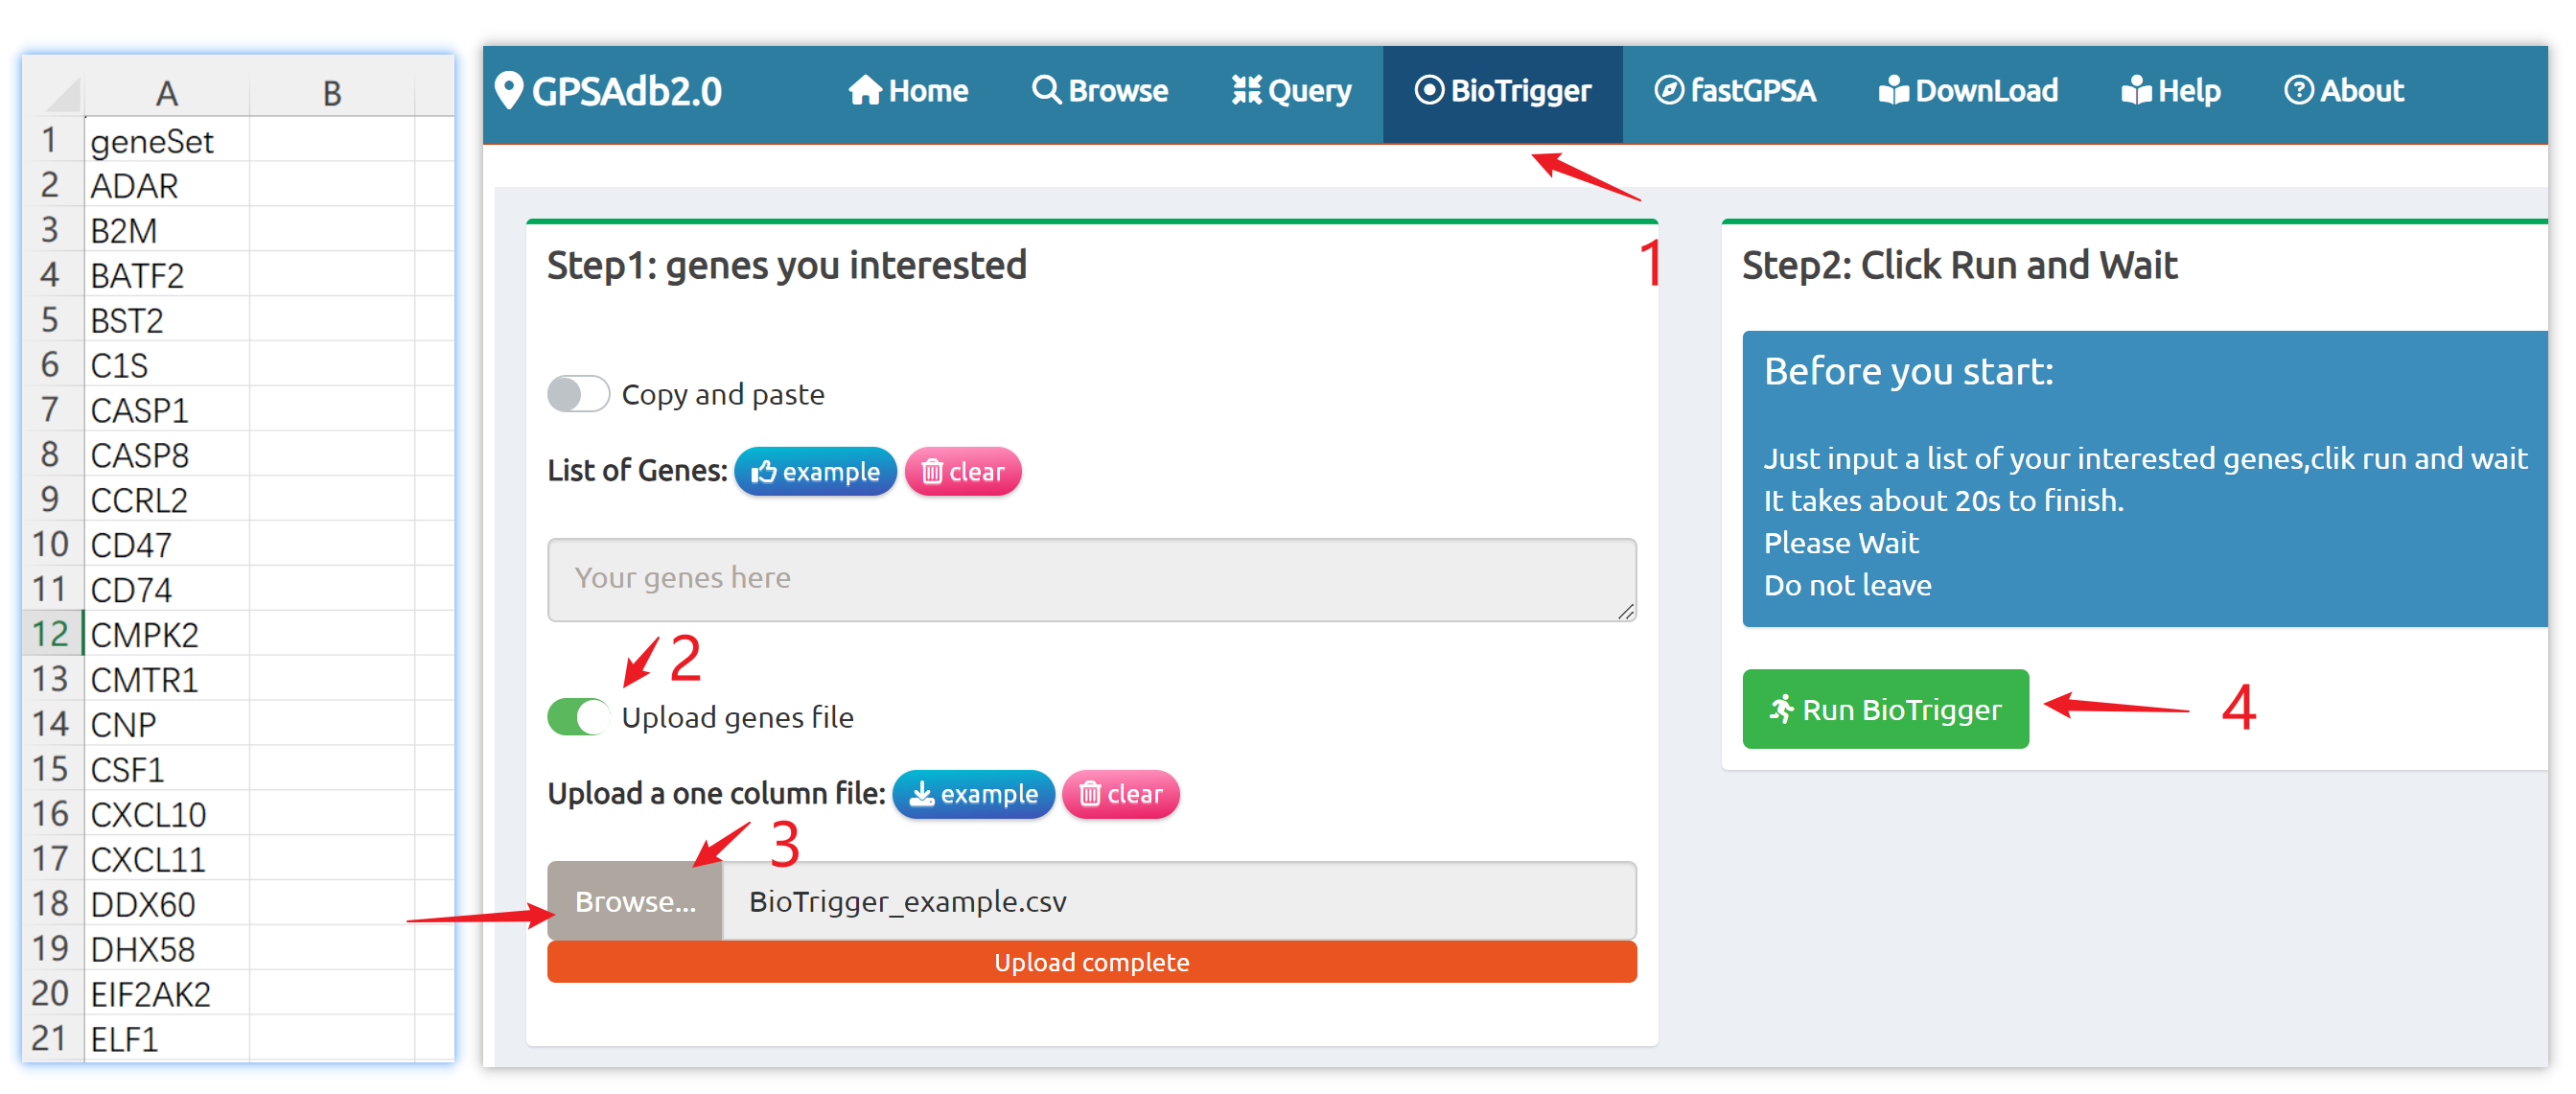
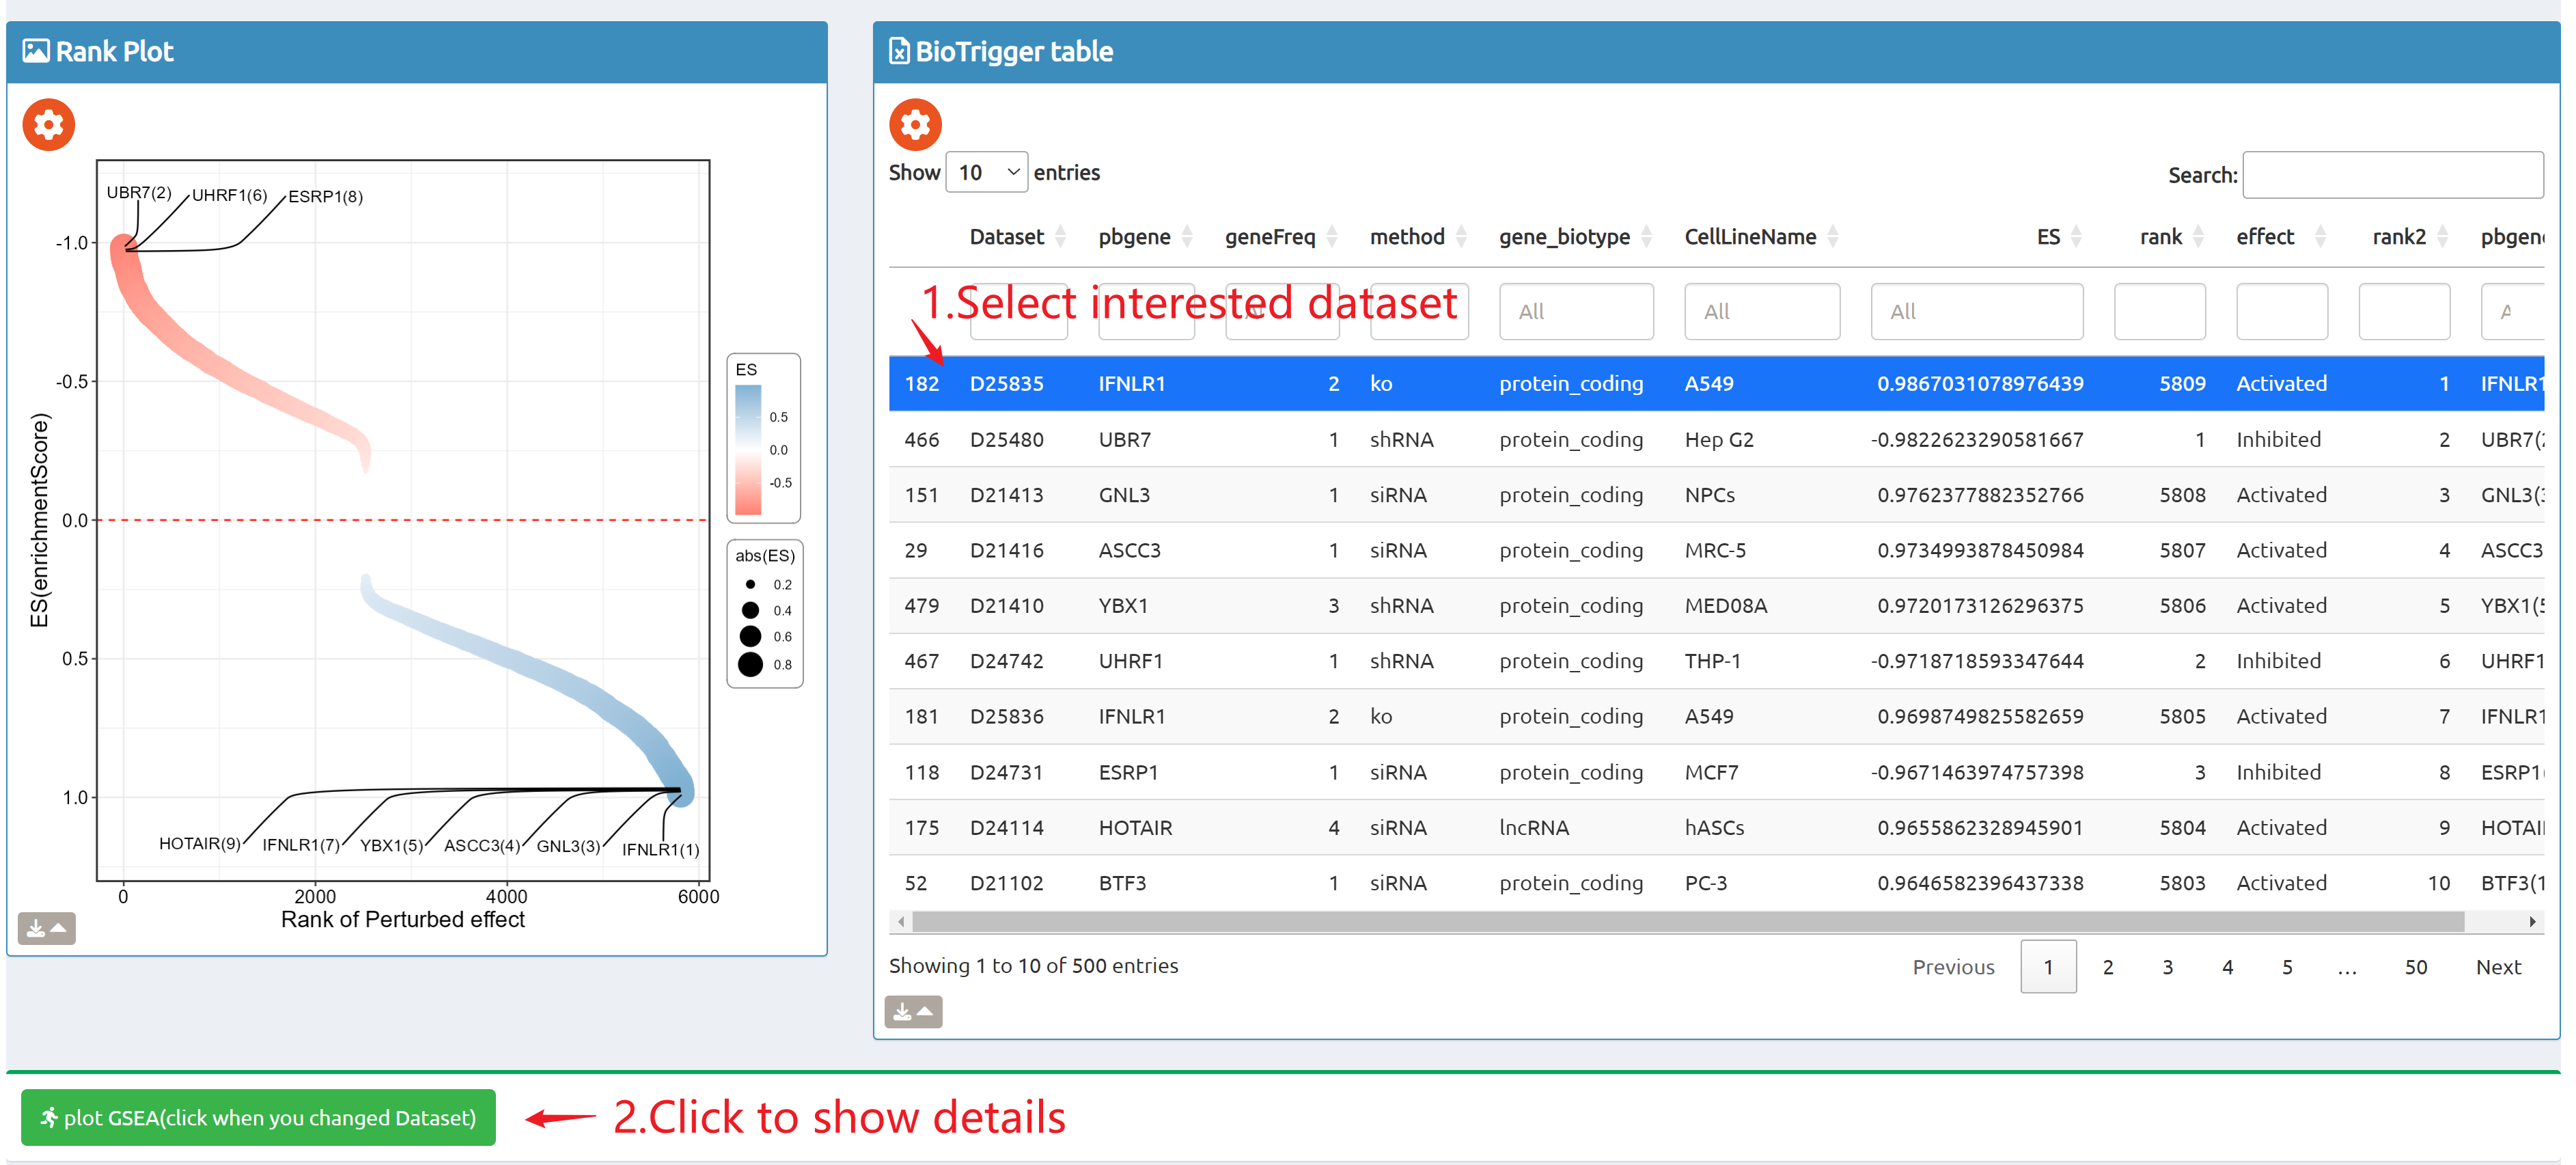
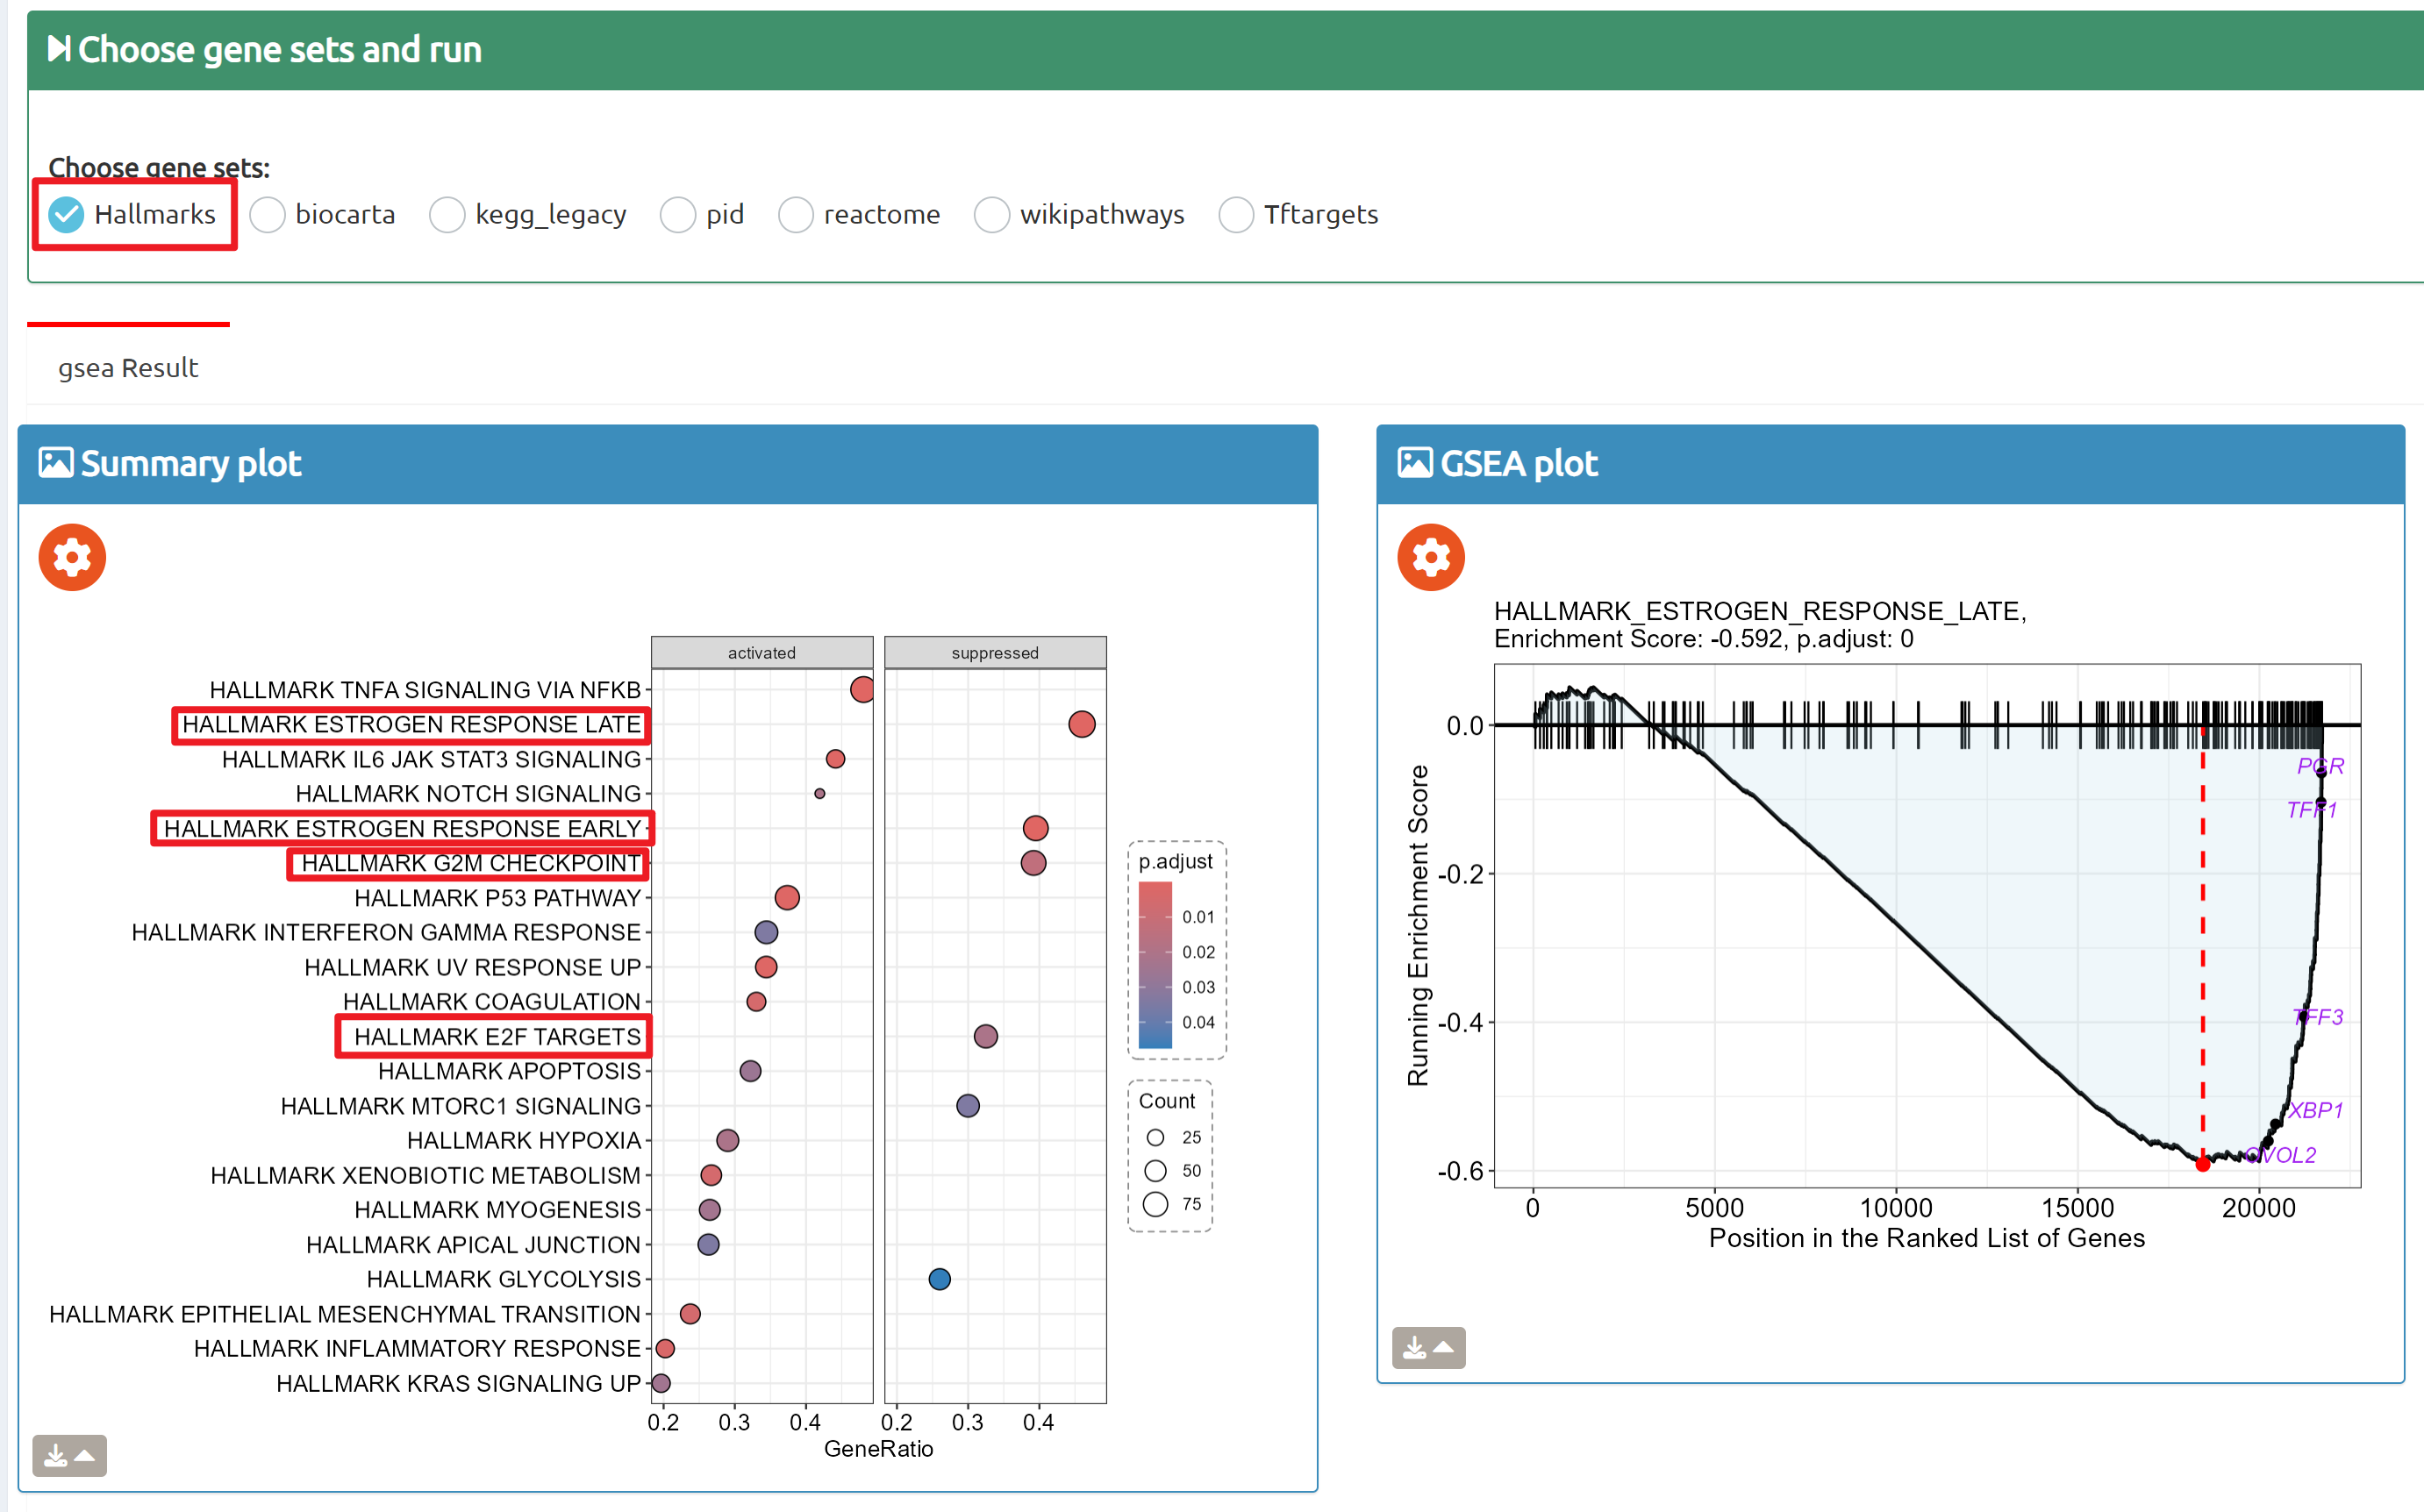
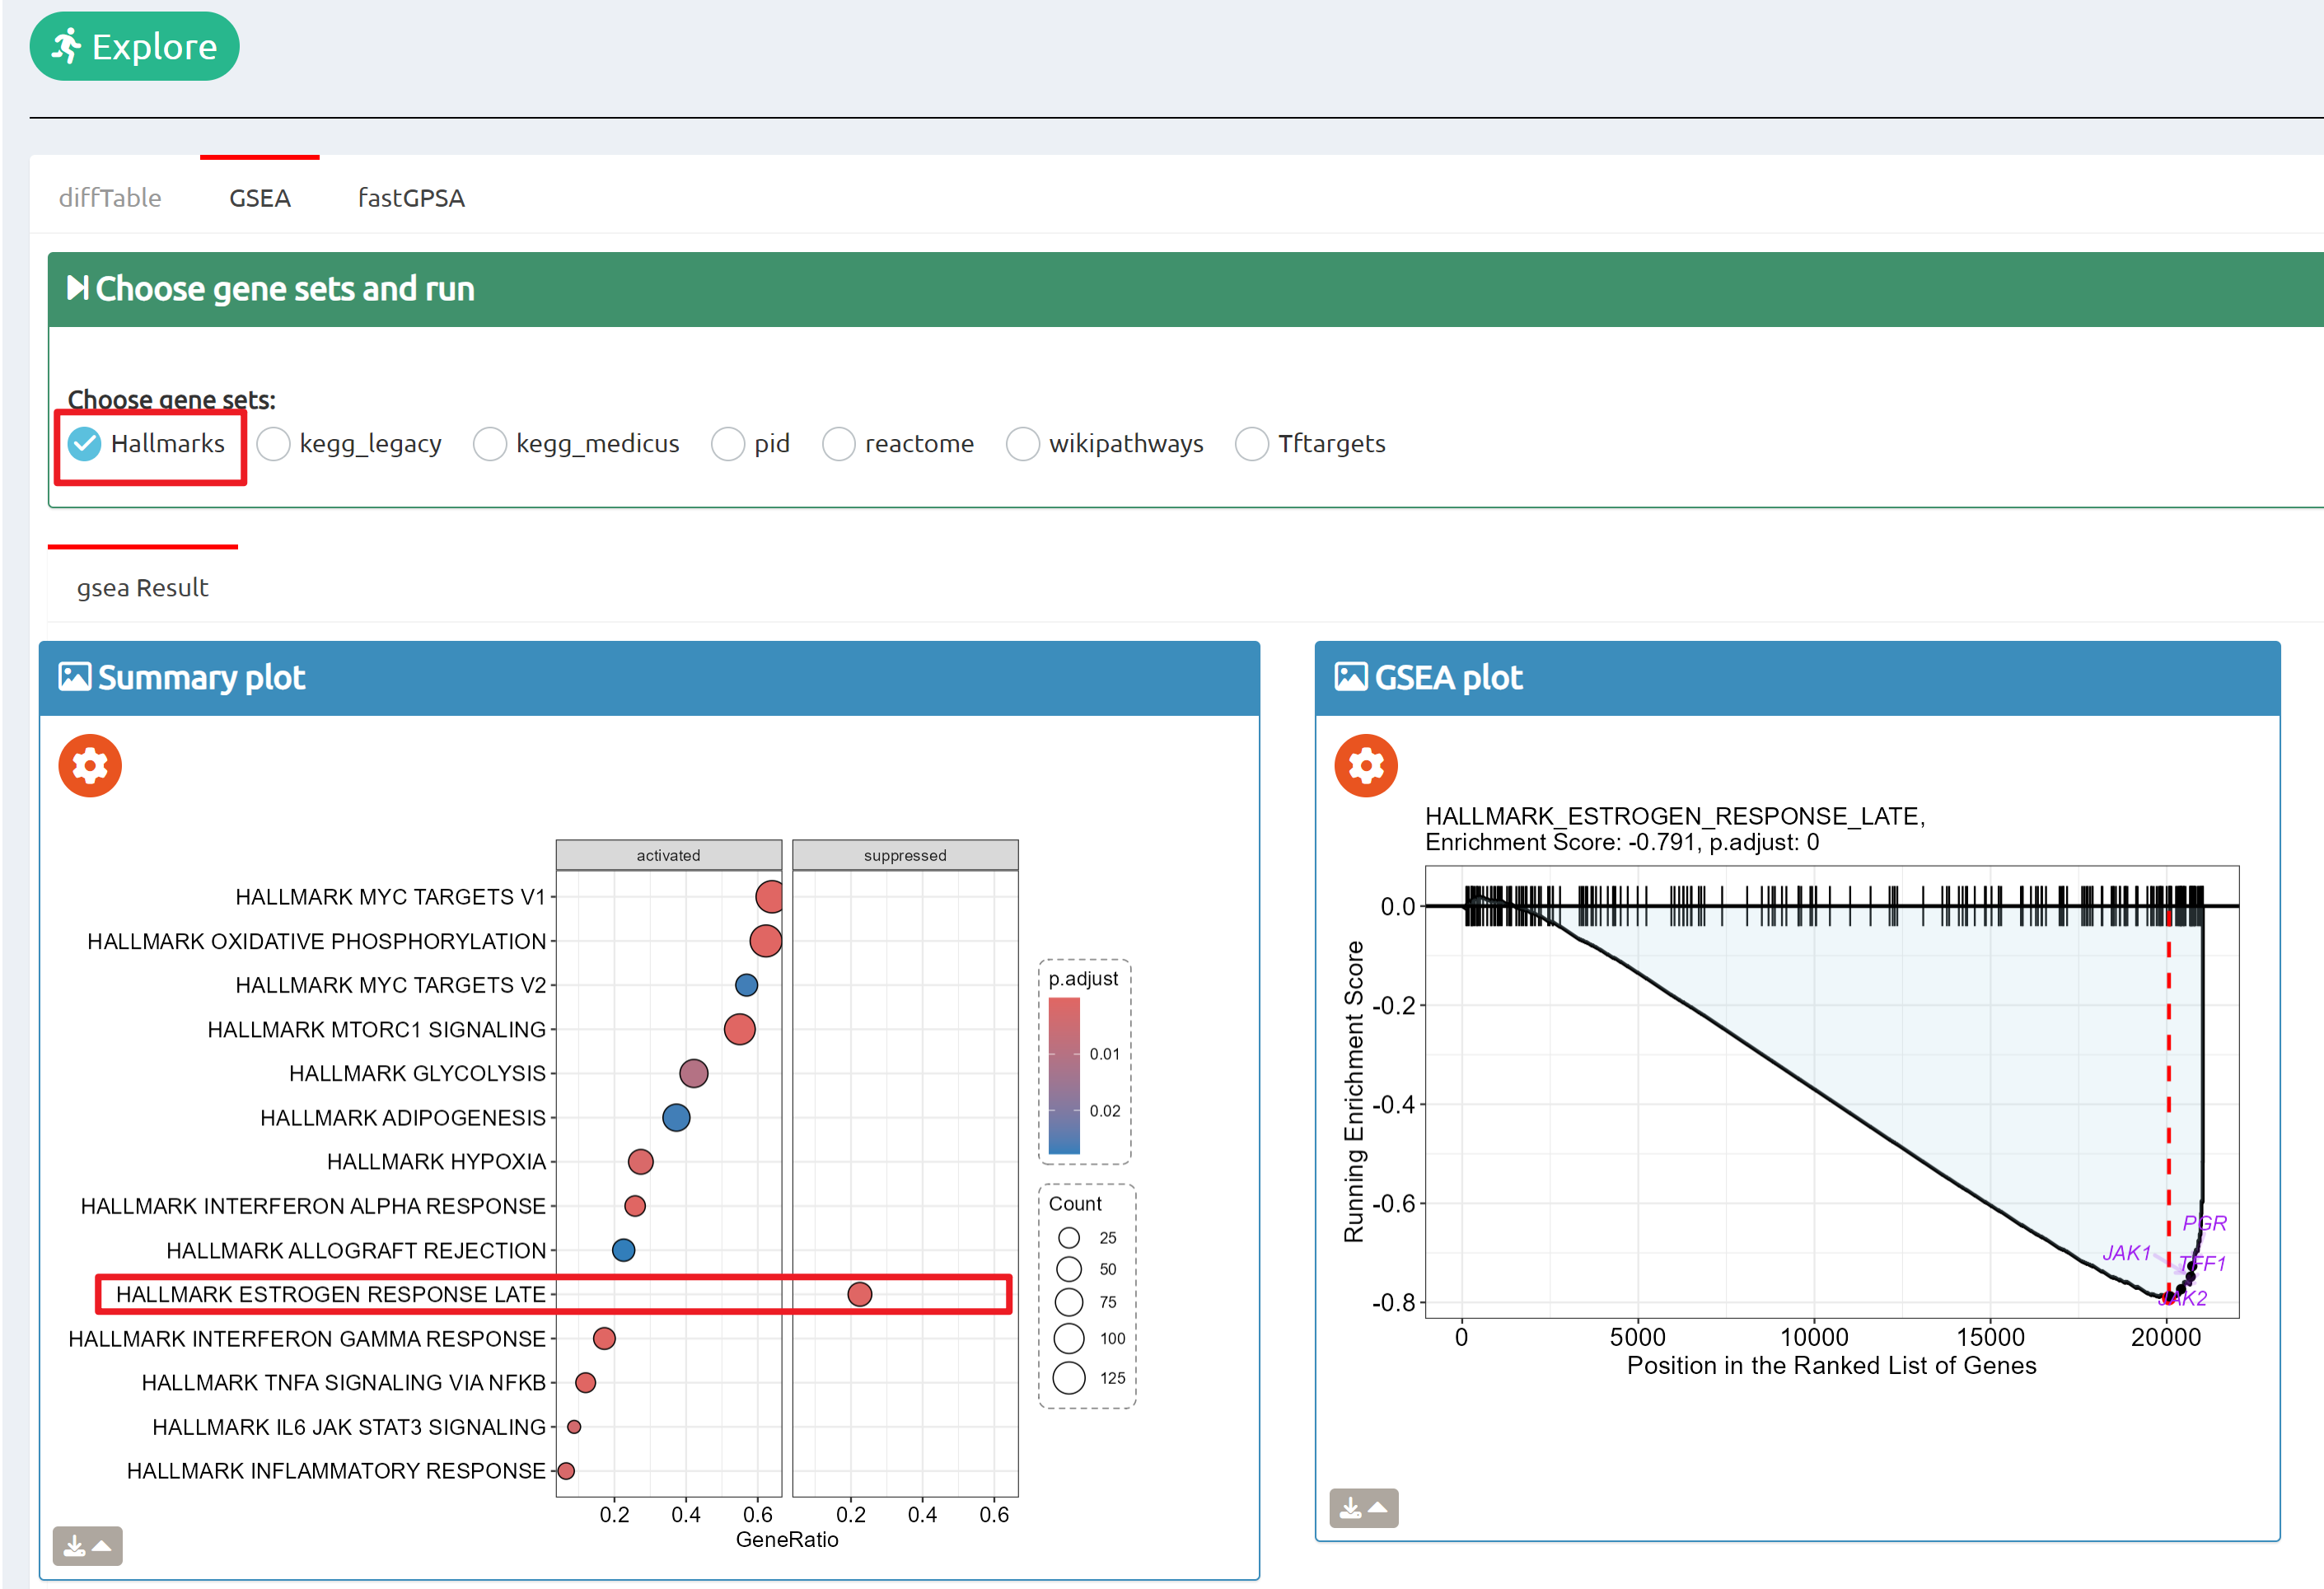
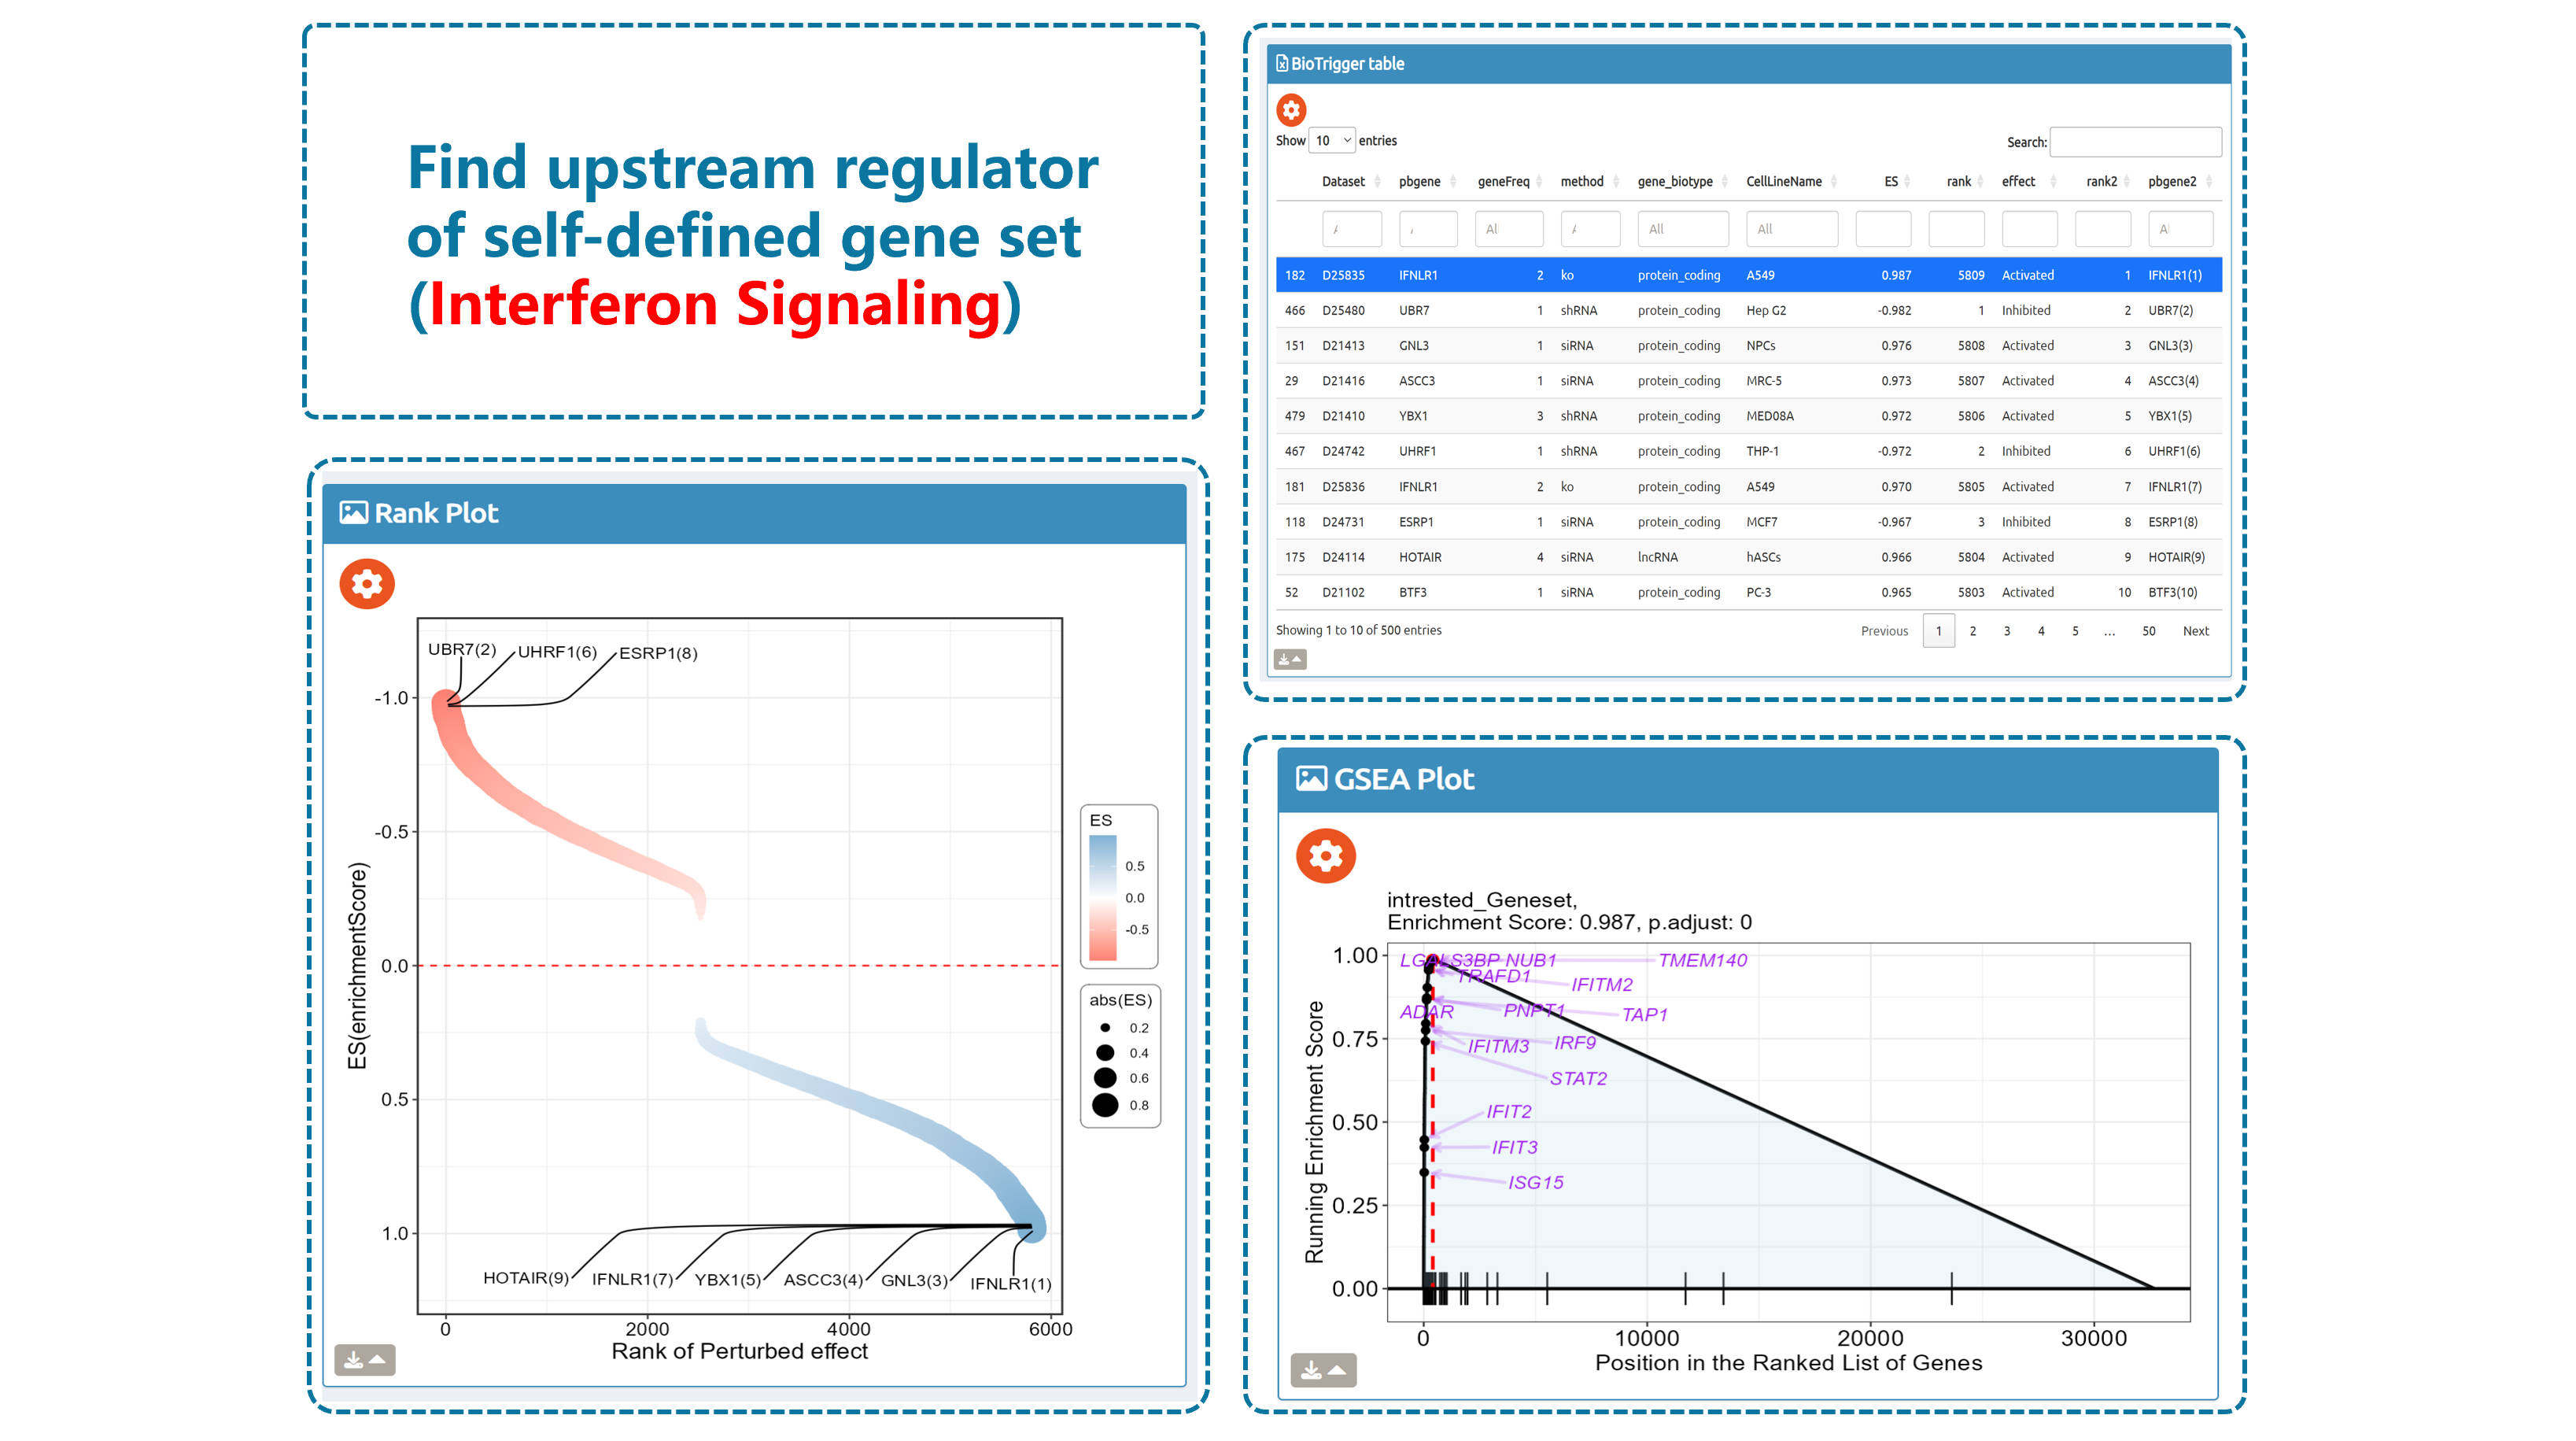
- BioTrigger: Run flexible GSEA on 5,809 curated datasets using a single or paired gene set to identify upstream regulators of your biology of interest.
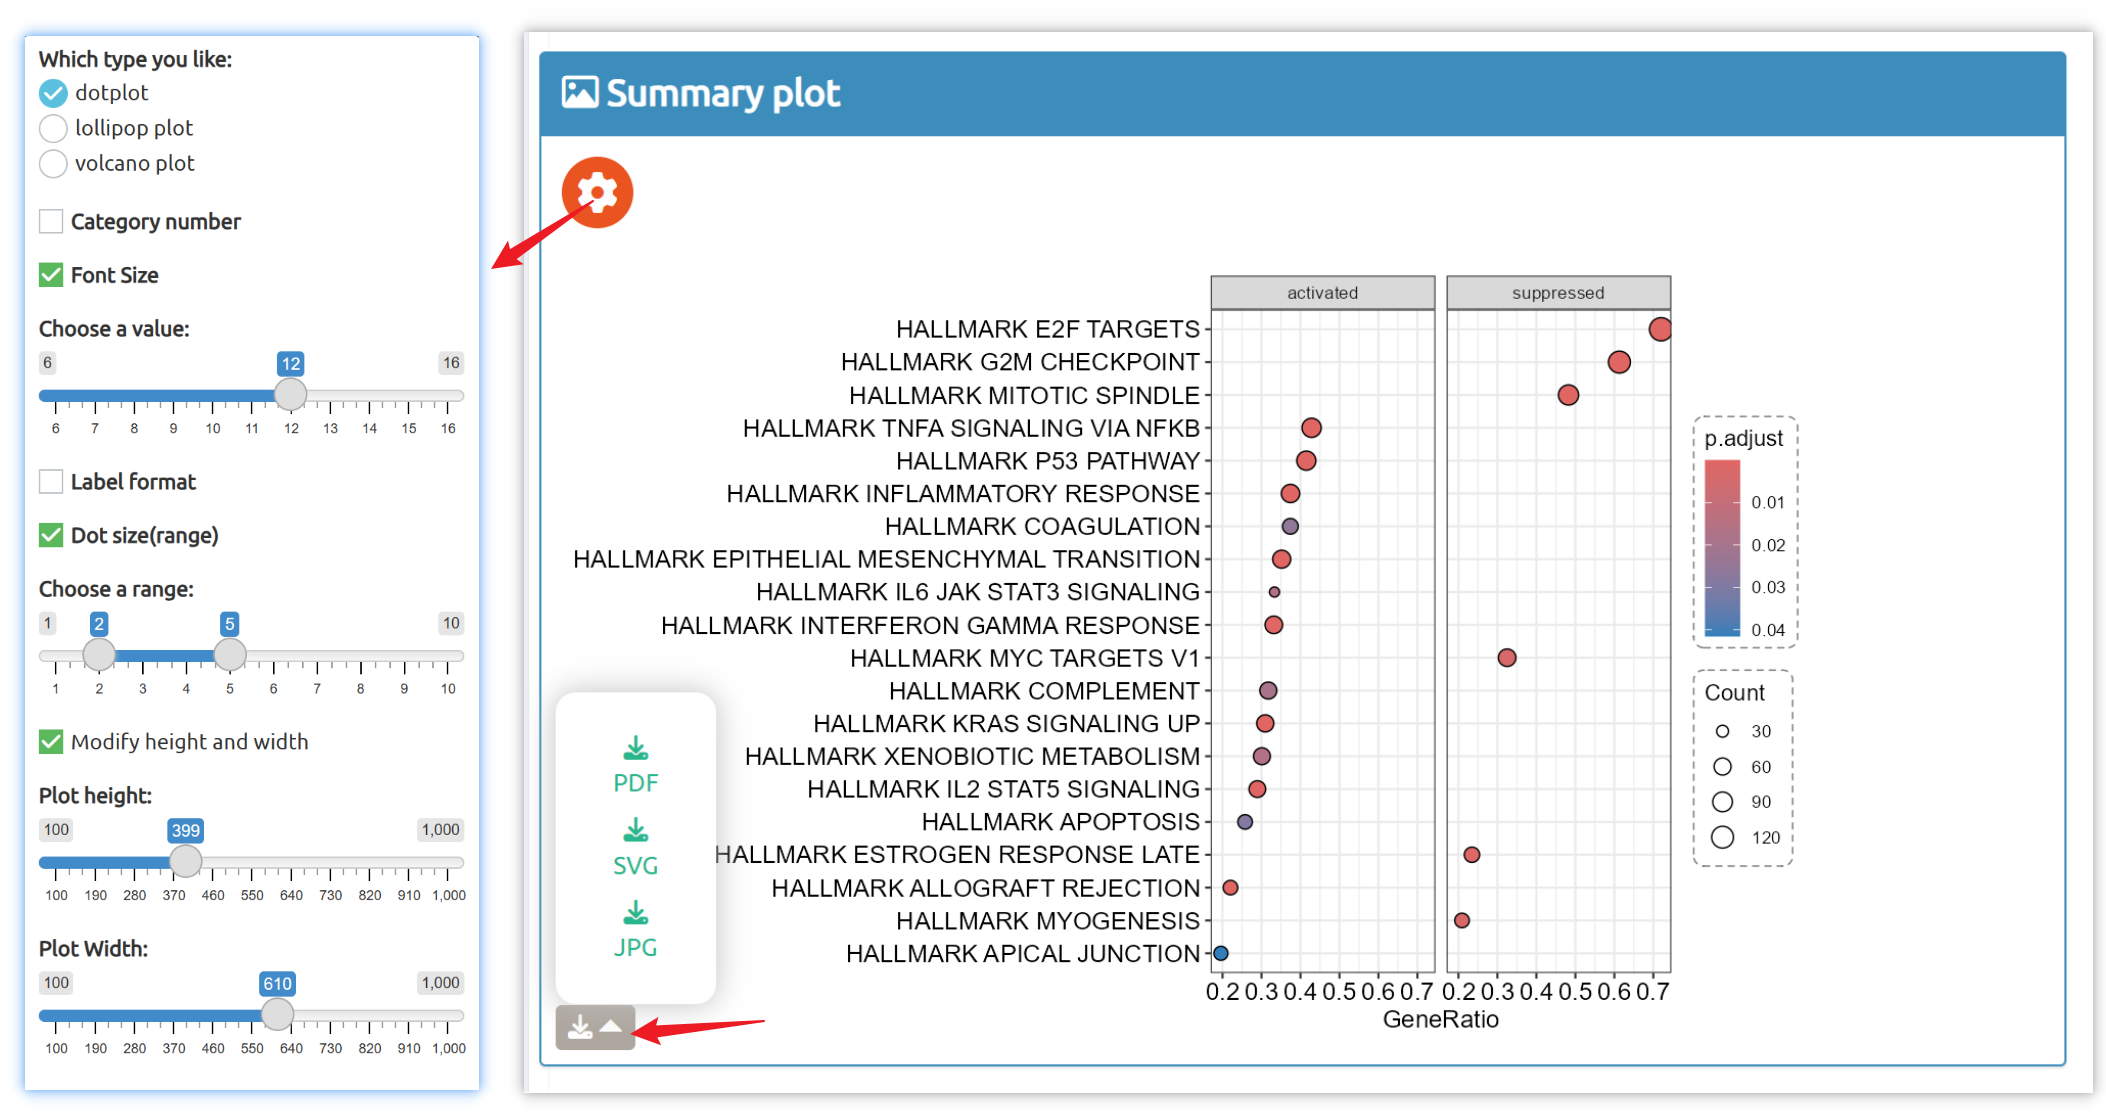
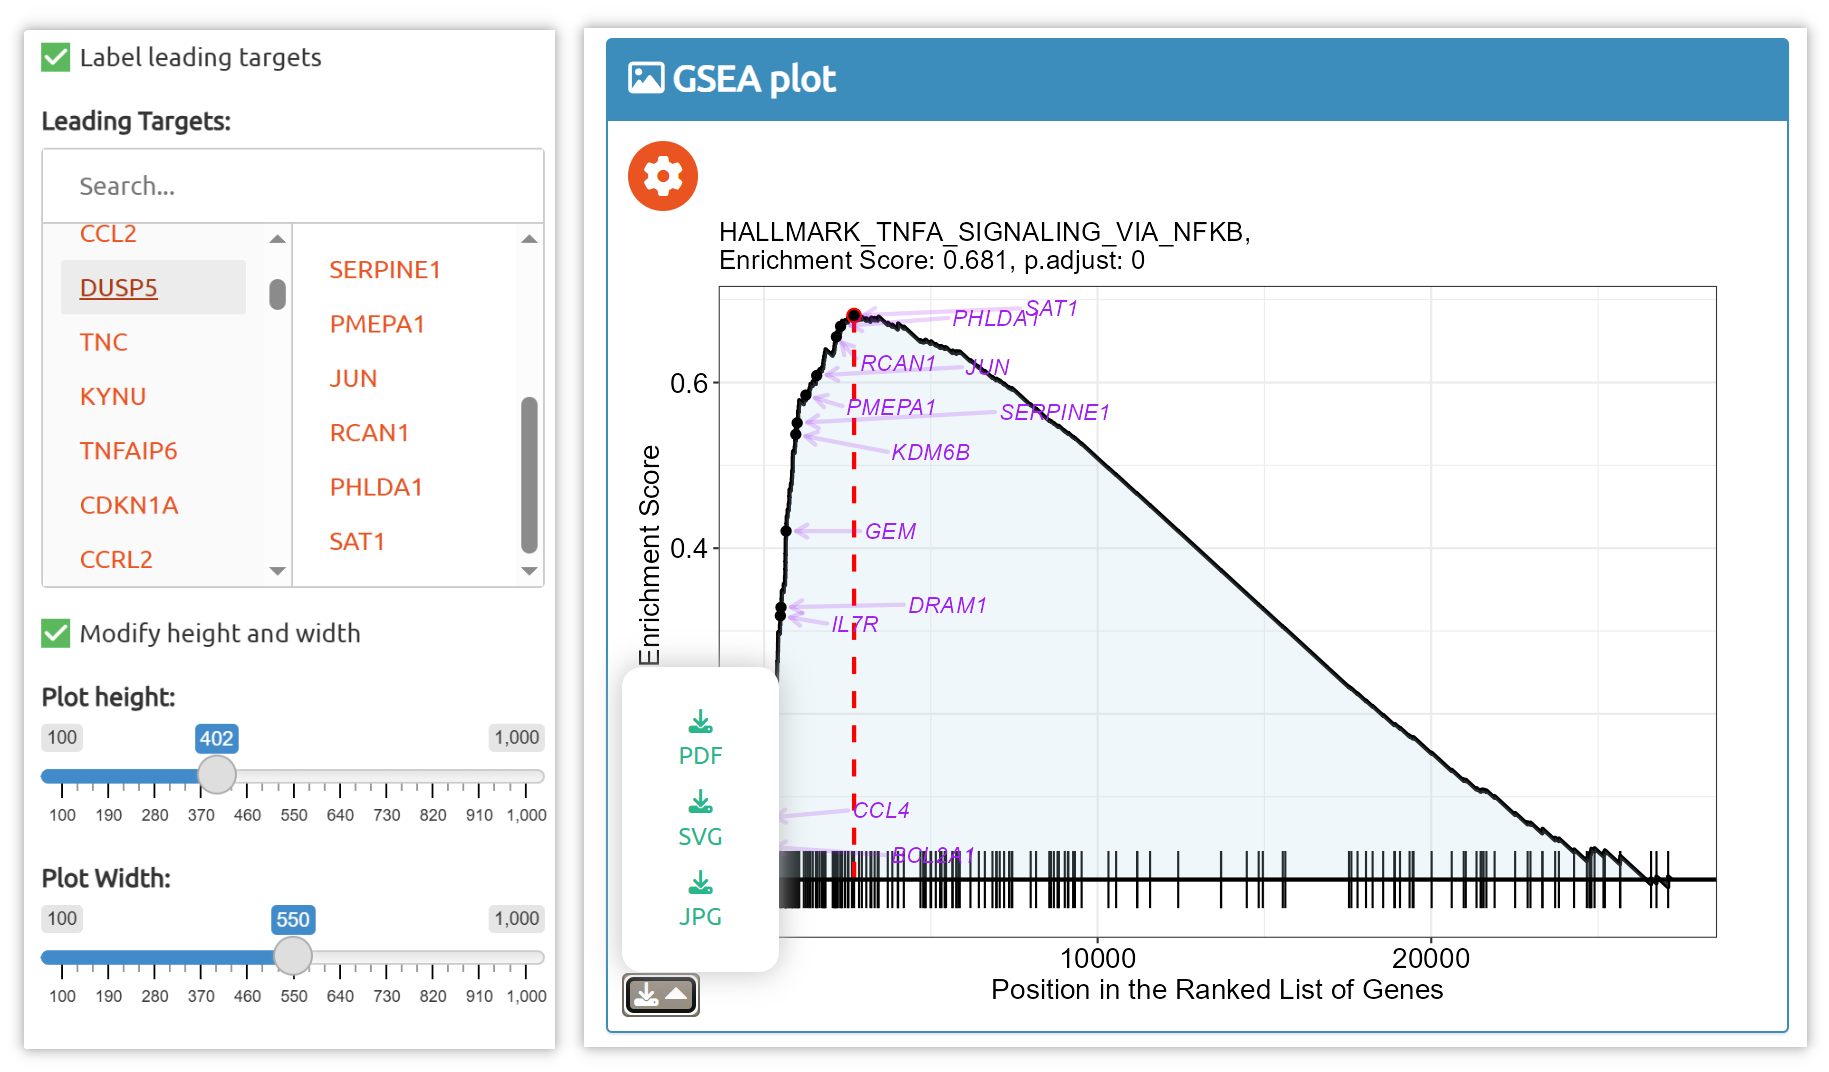
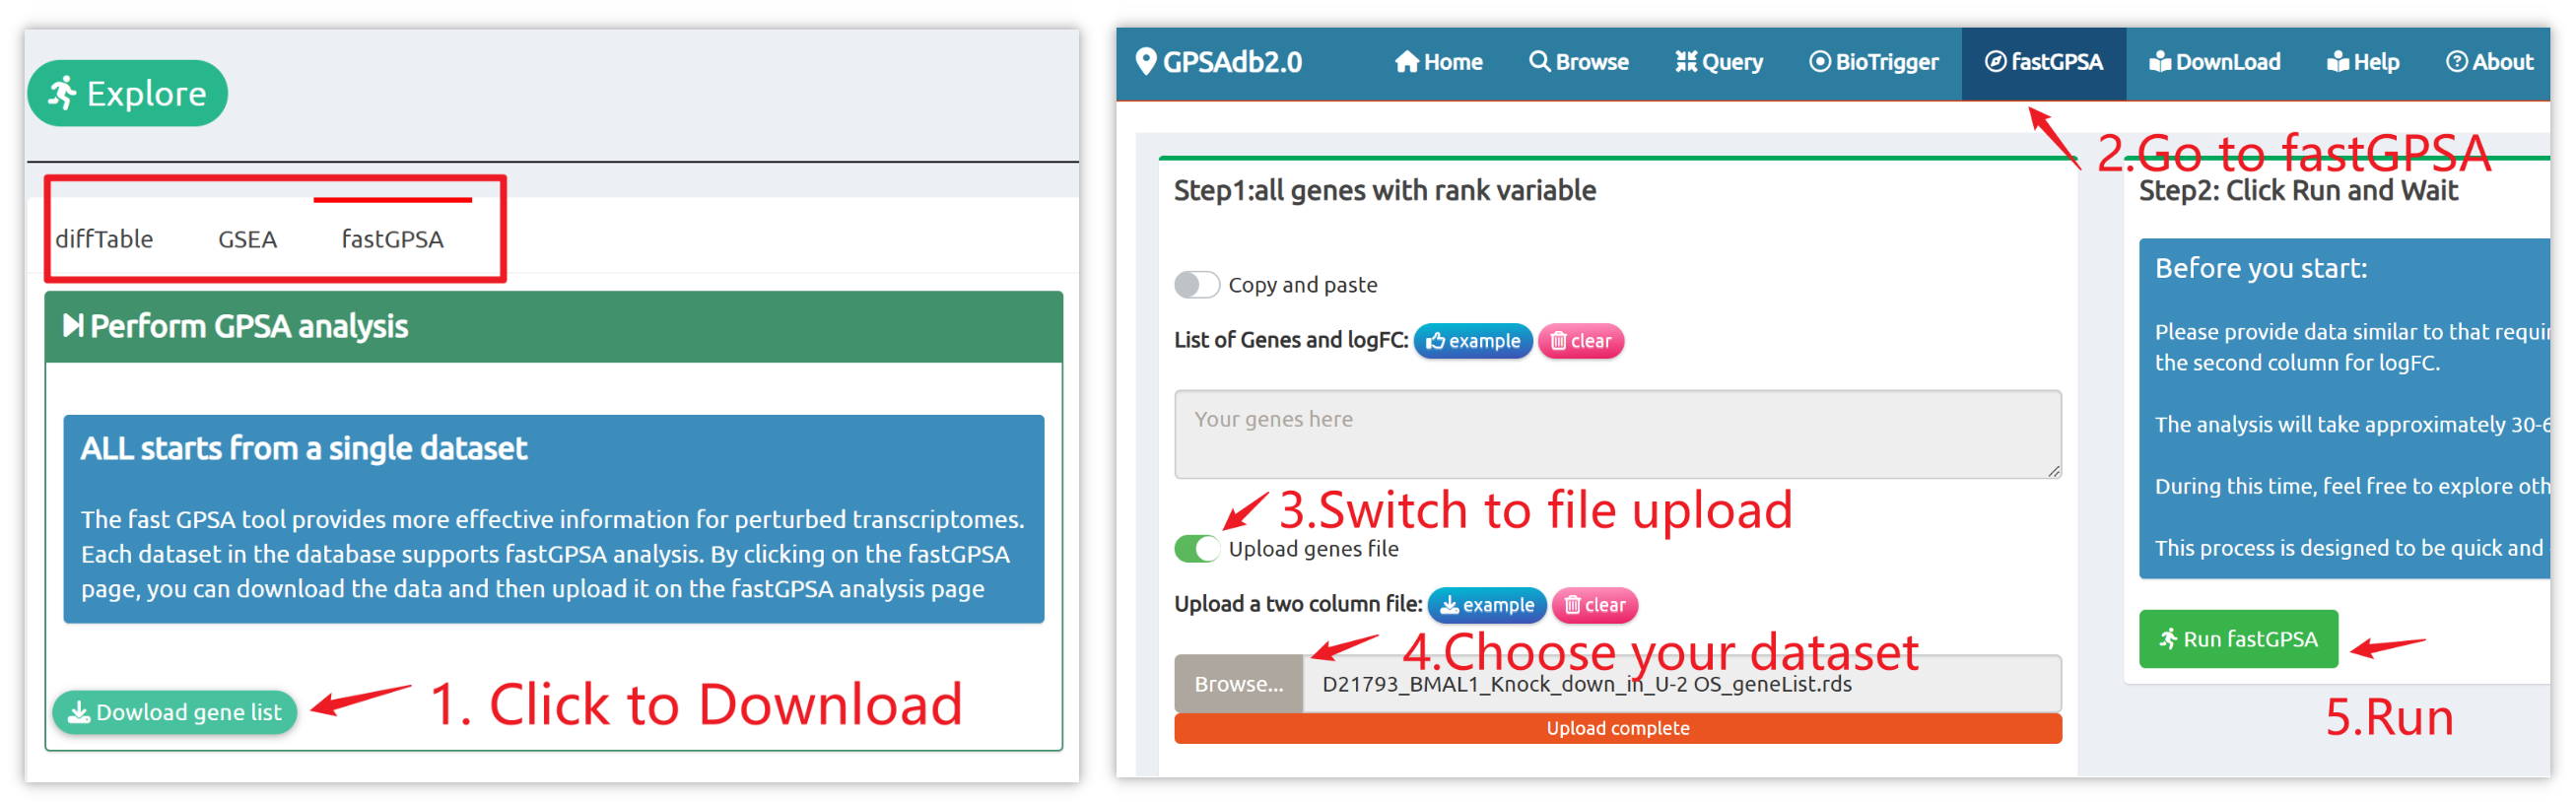
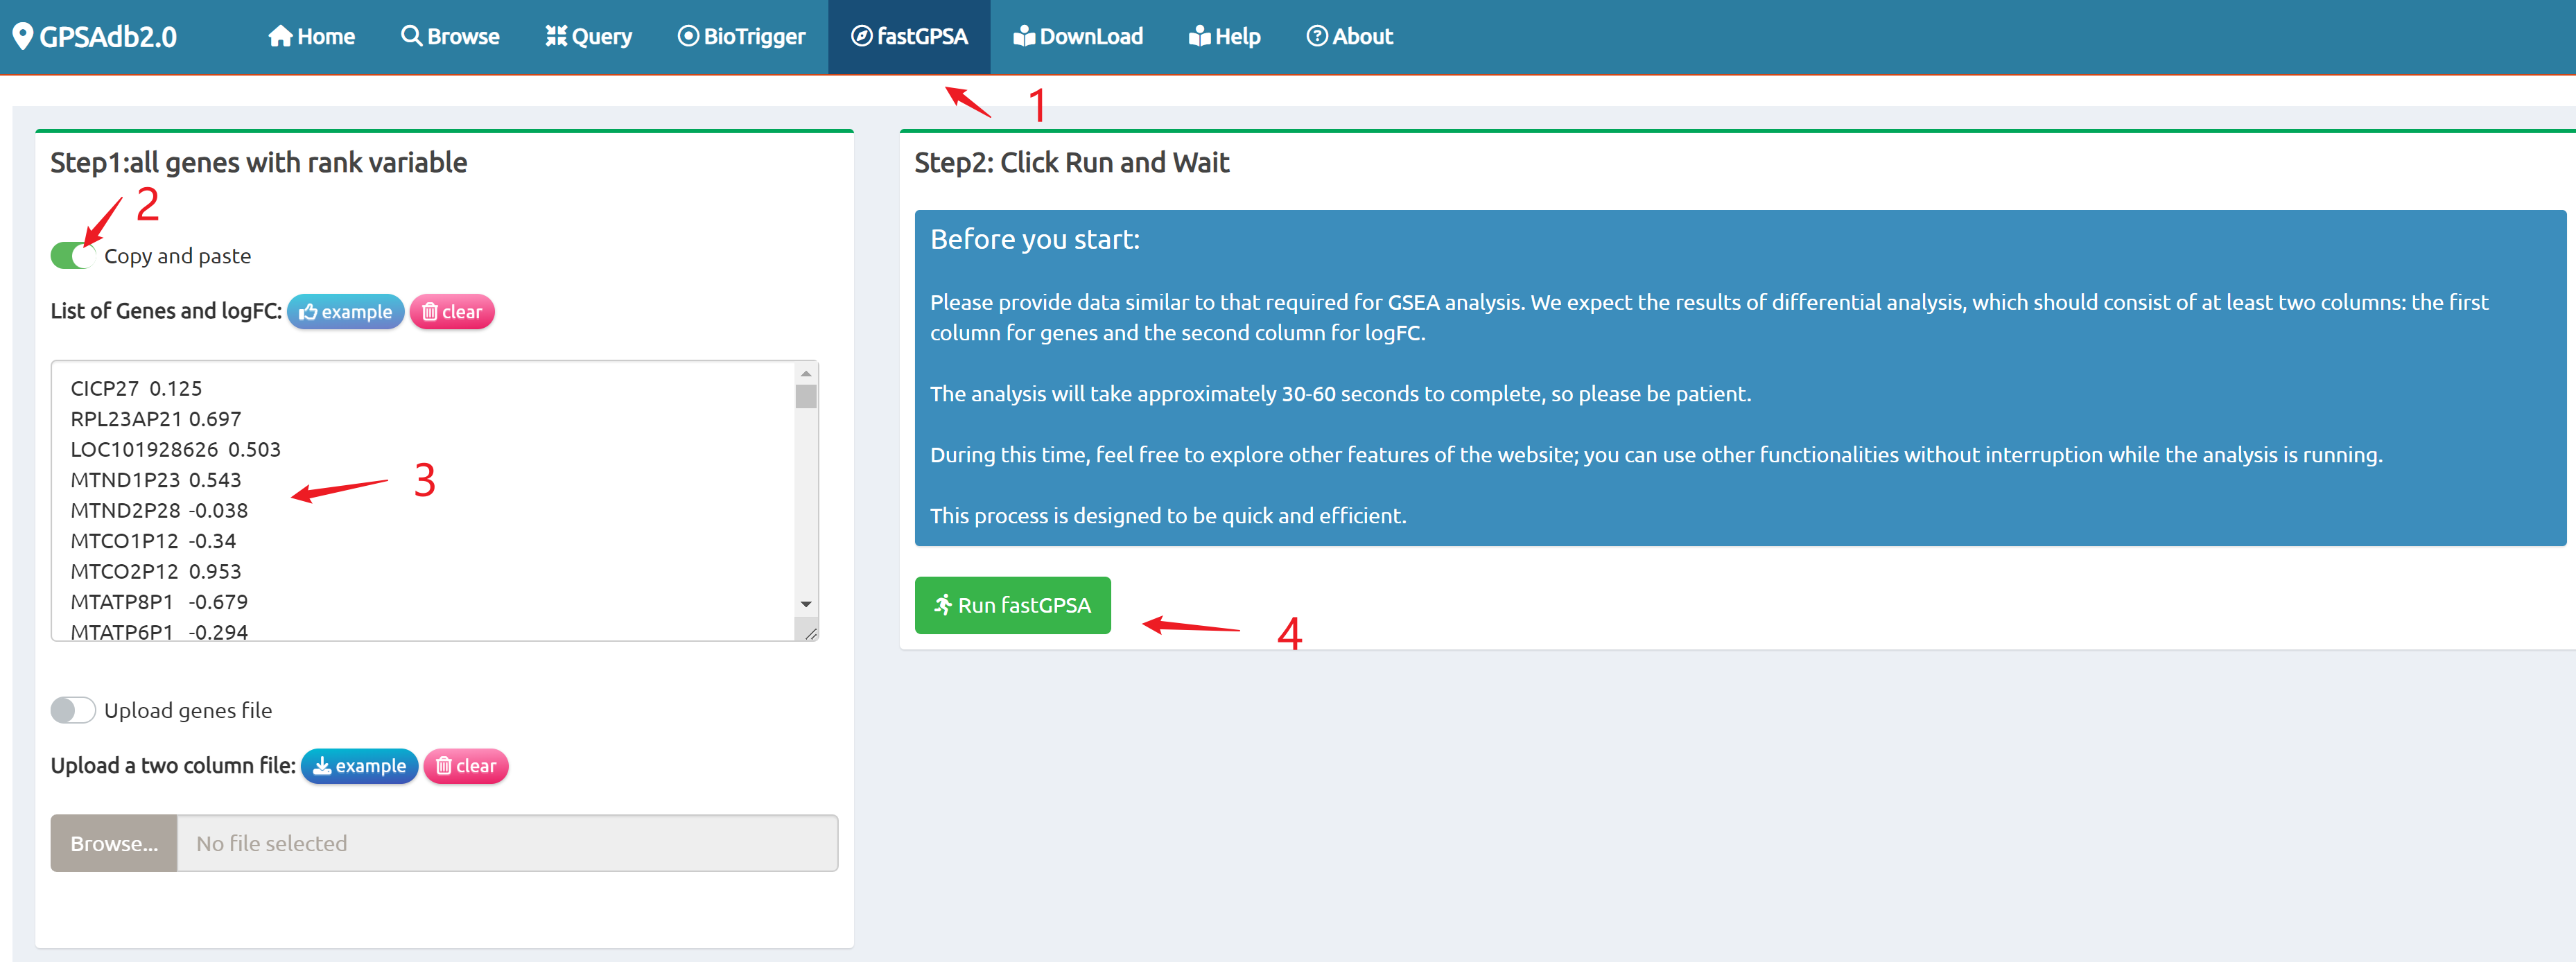
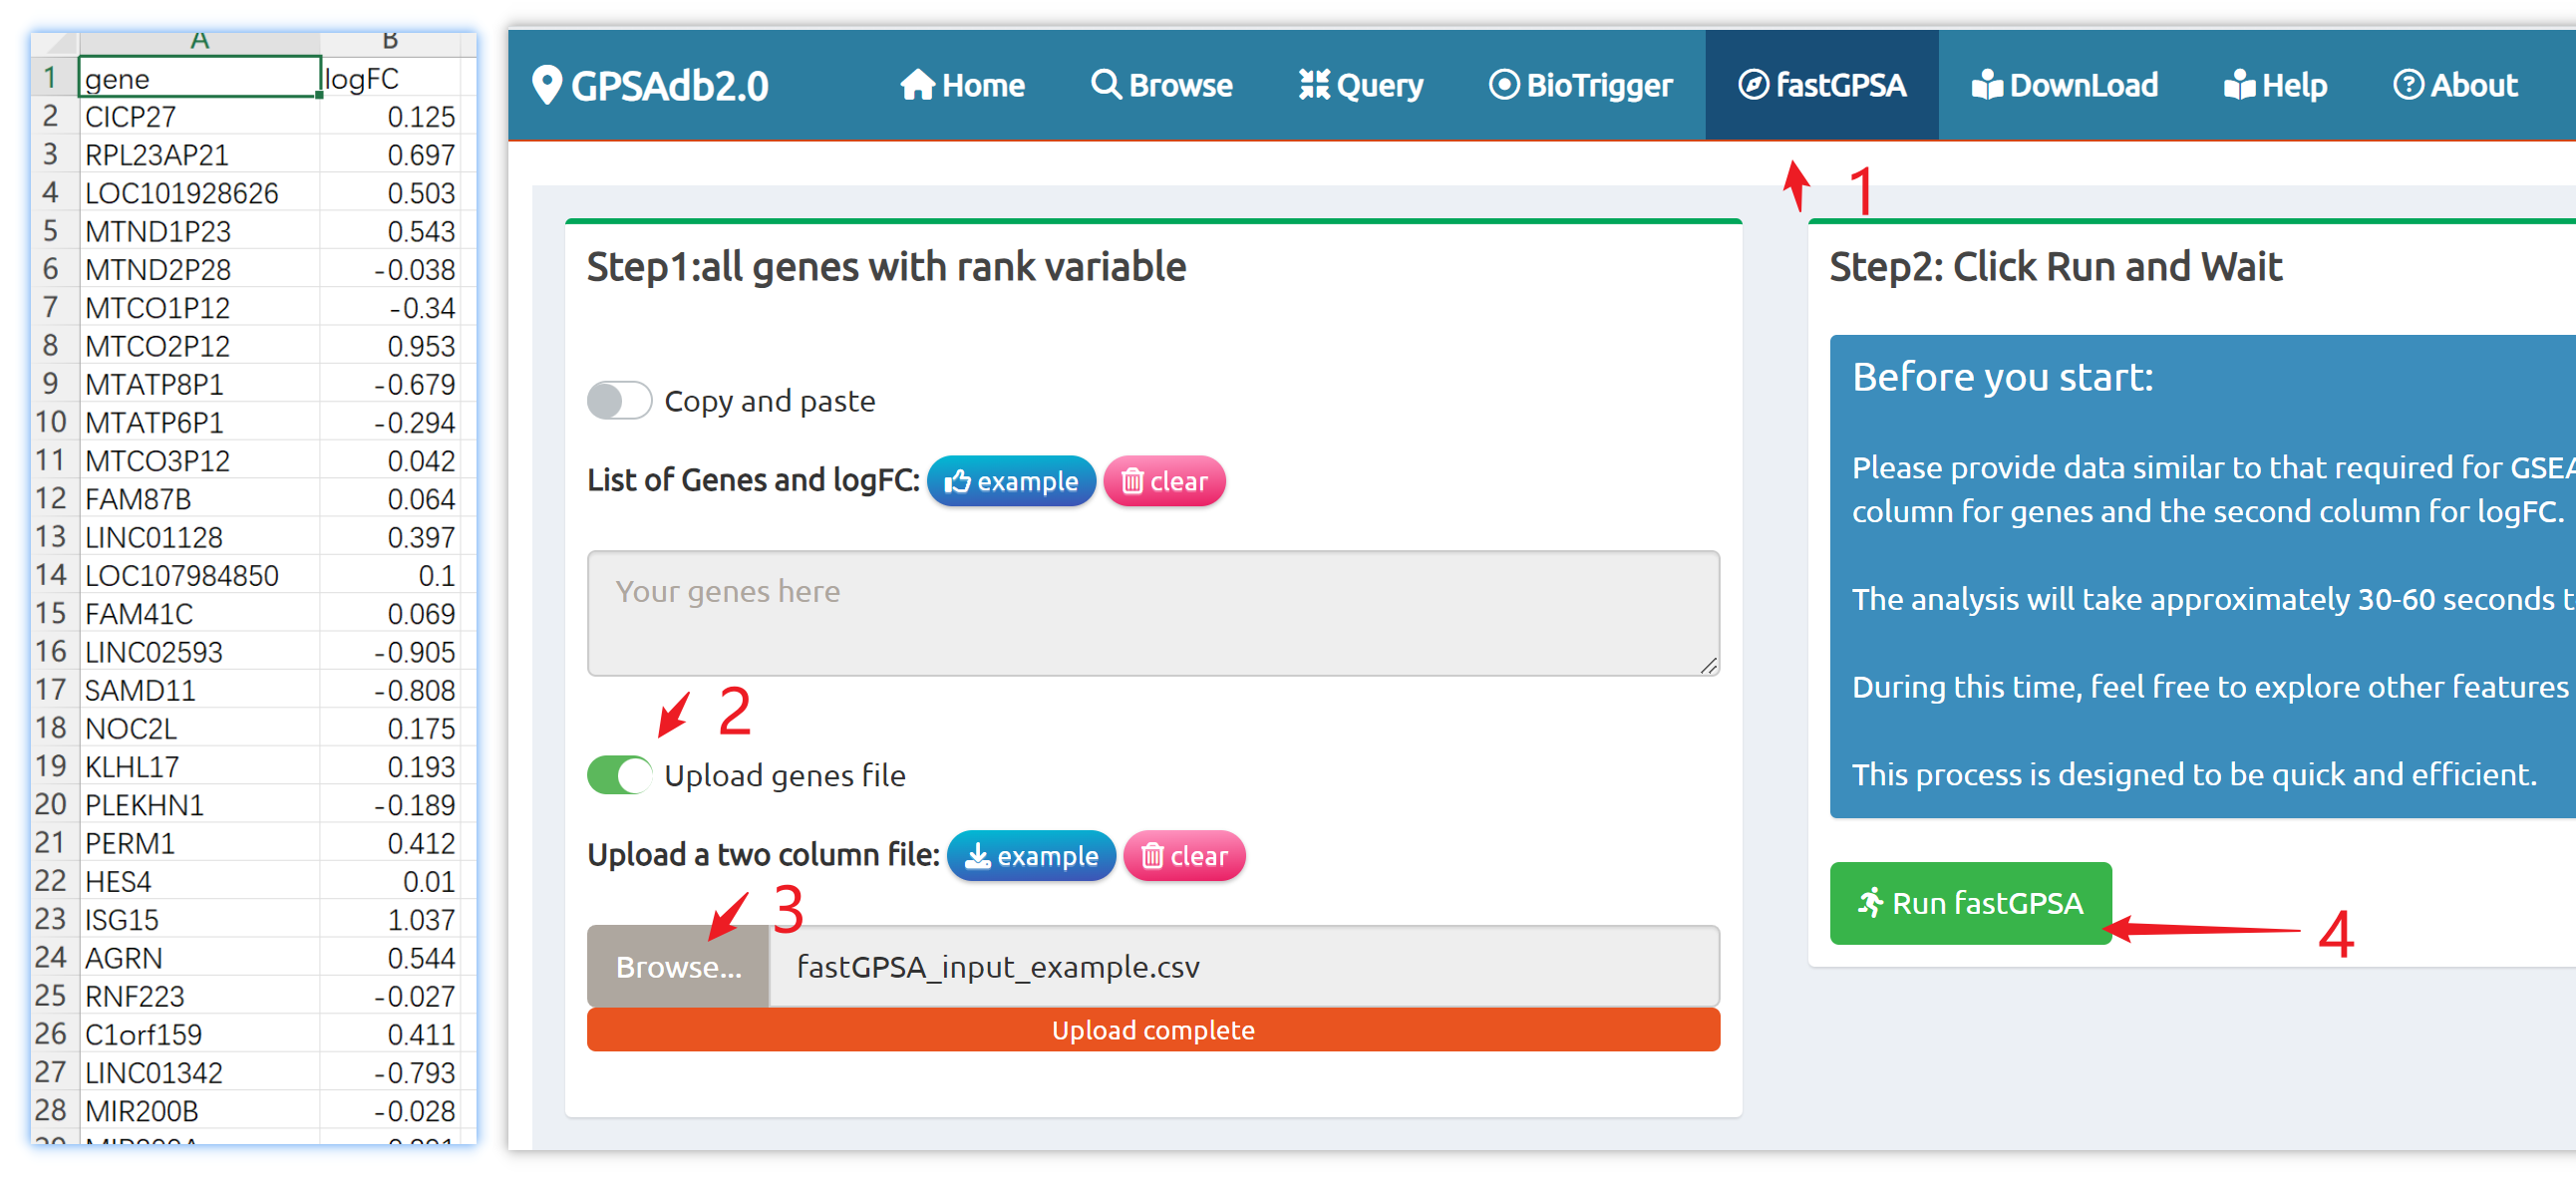
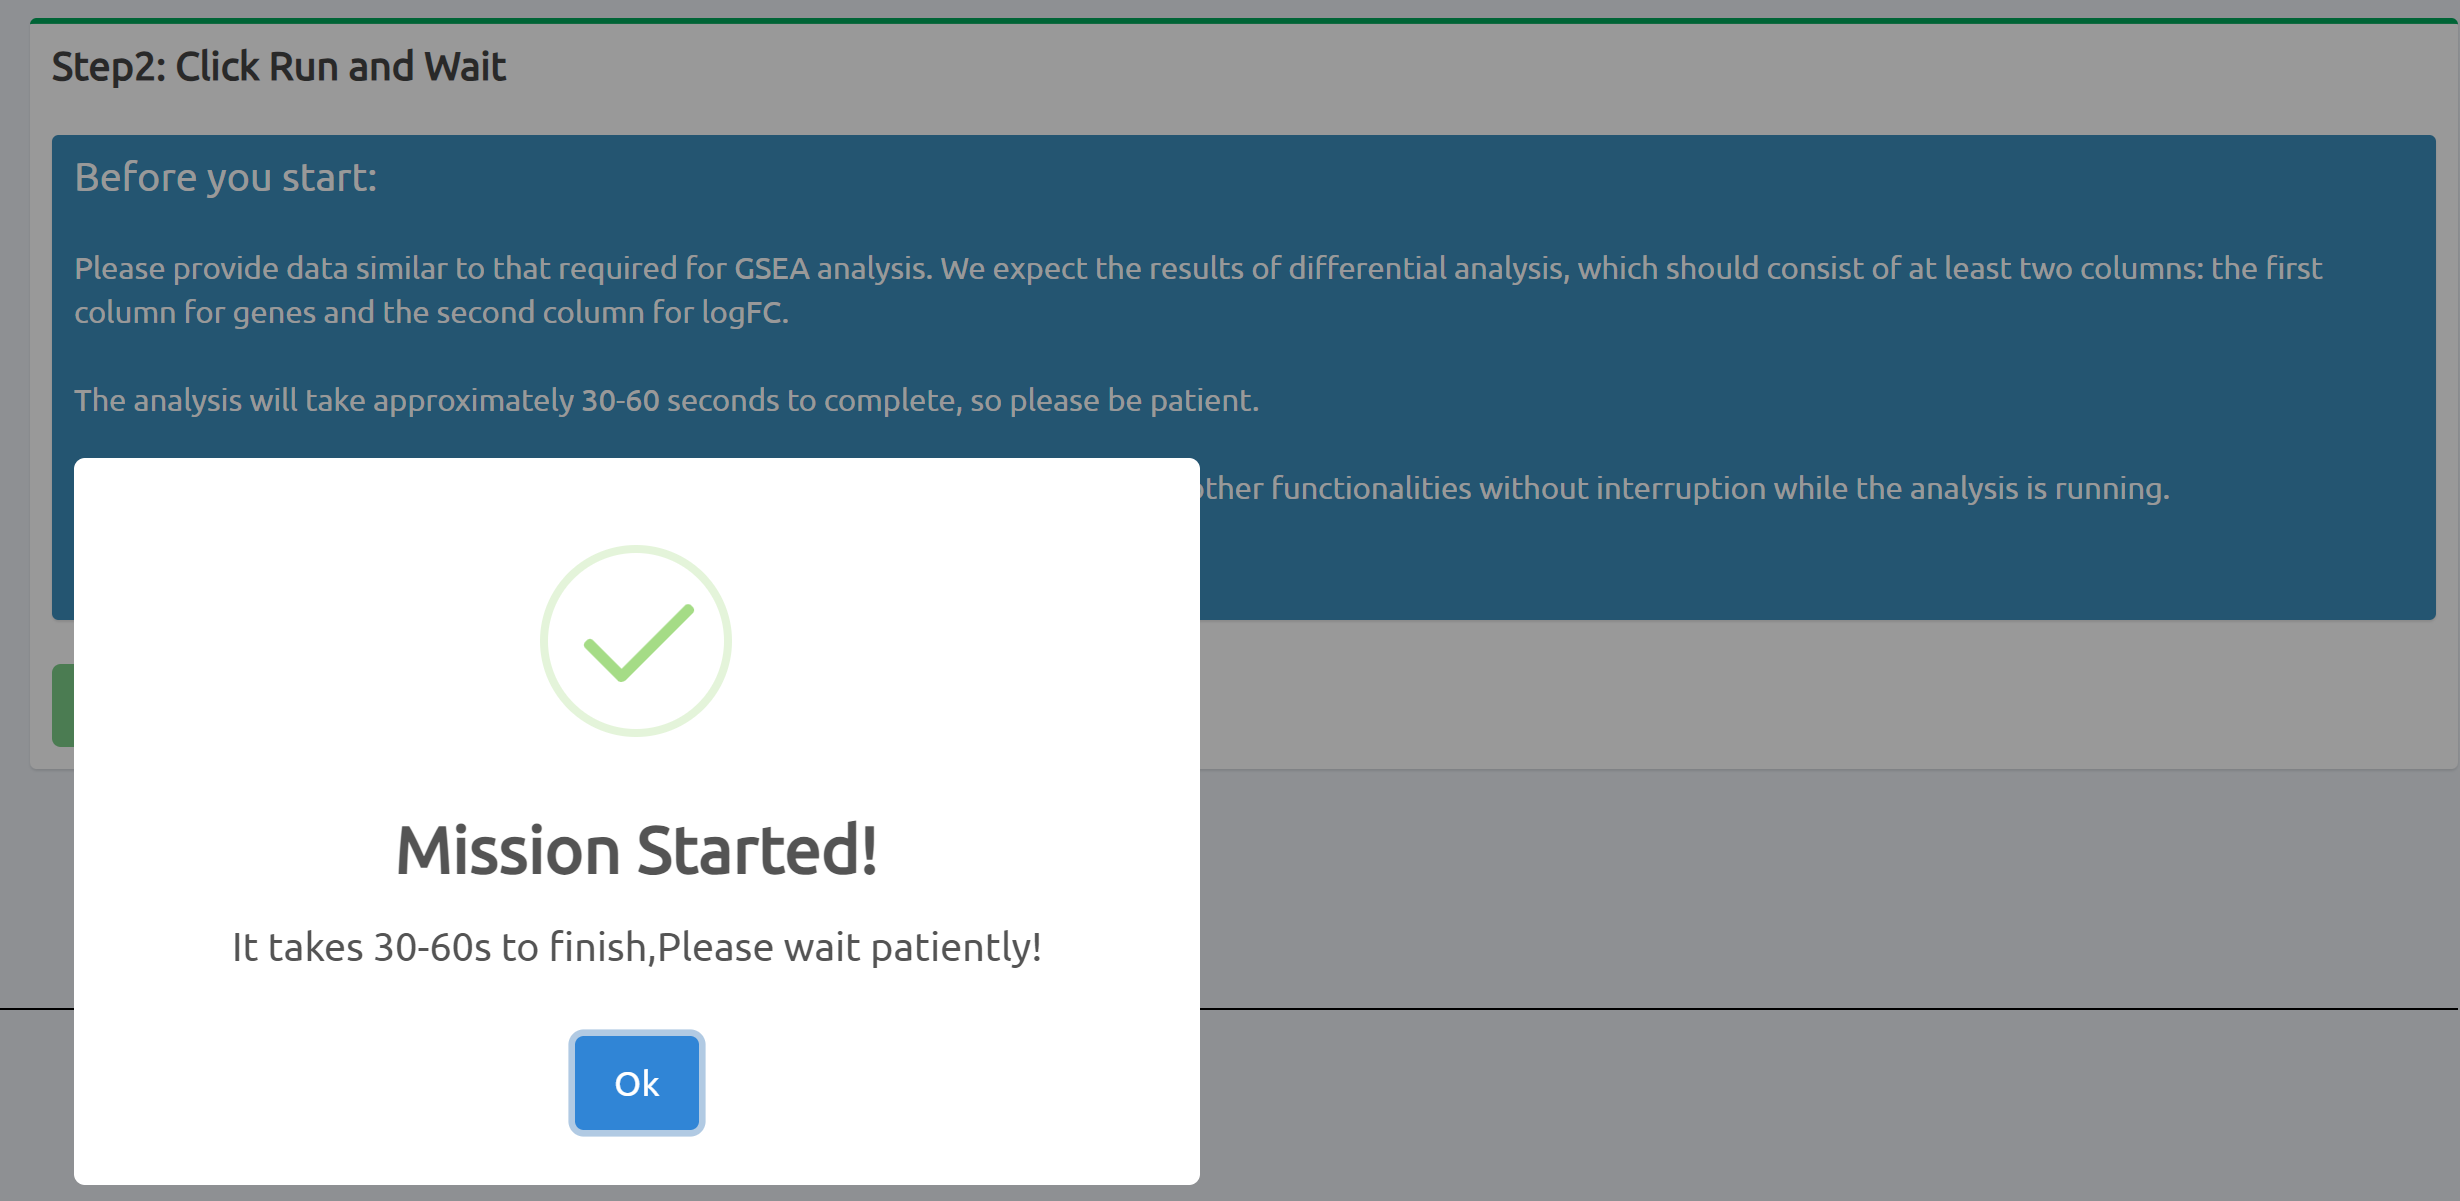
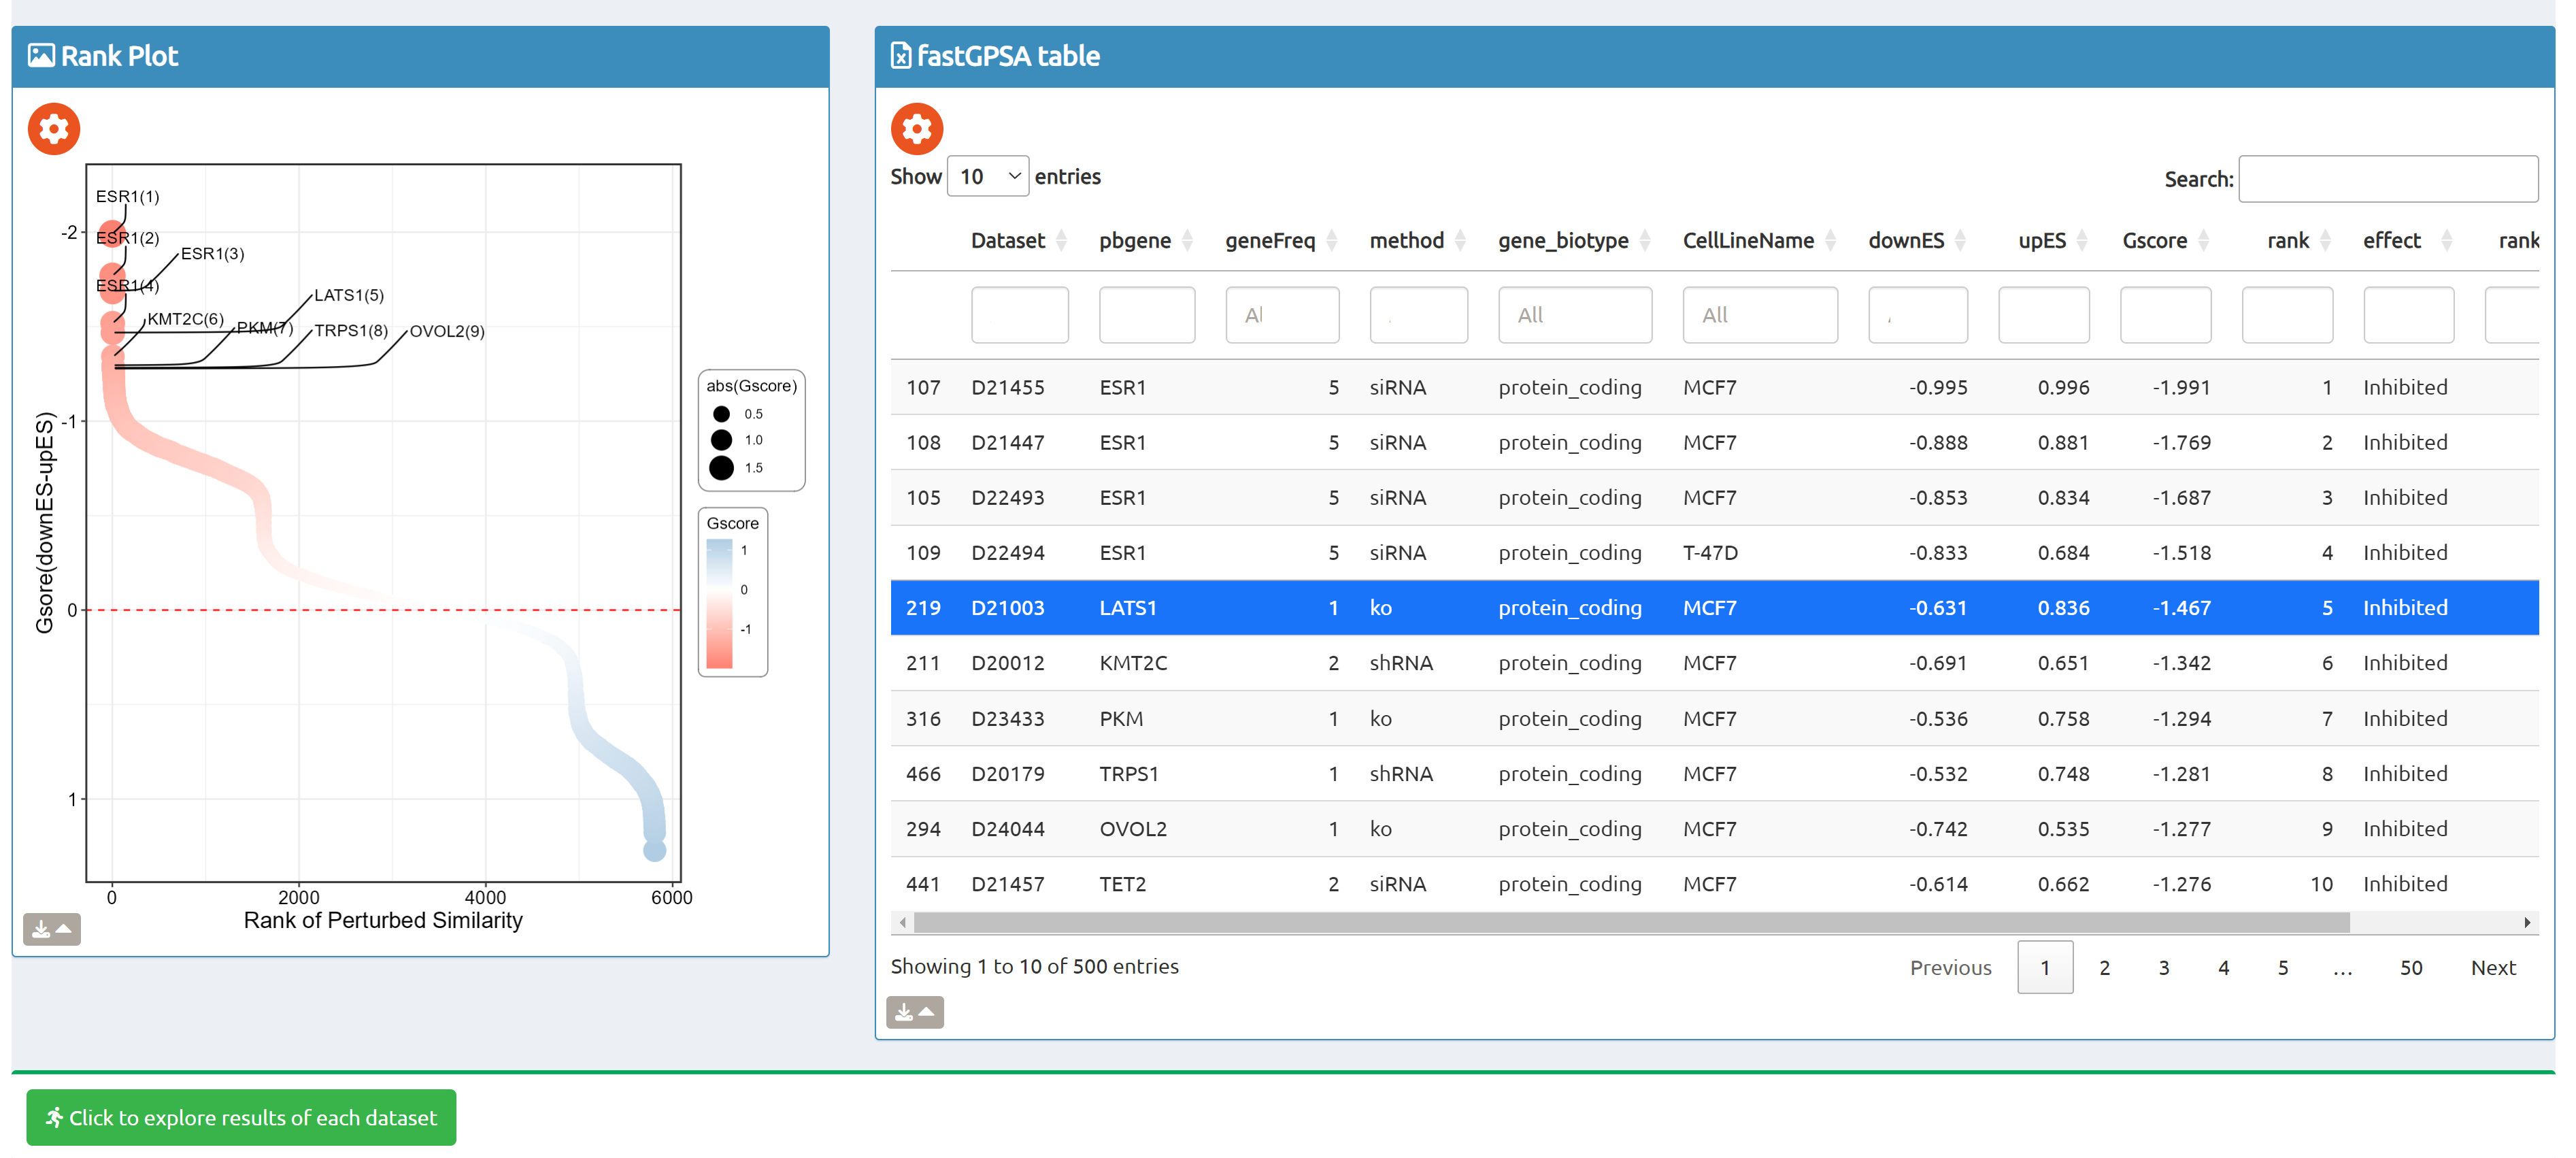
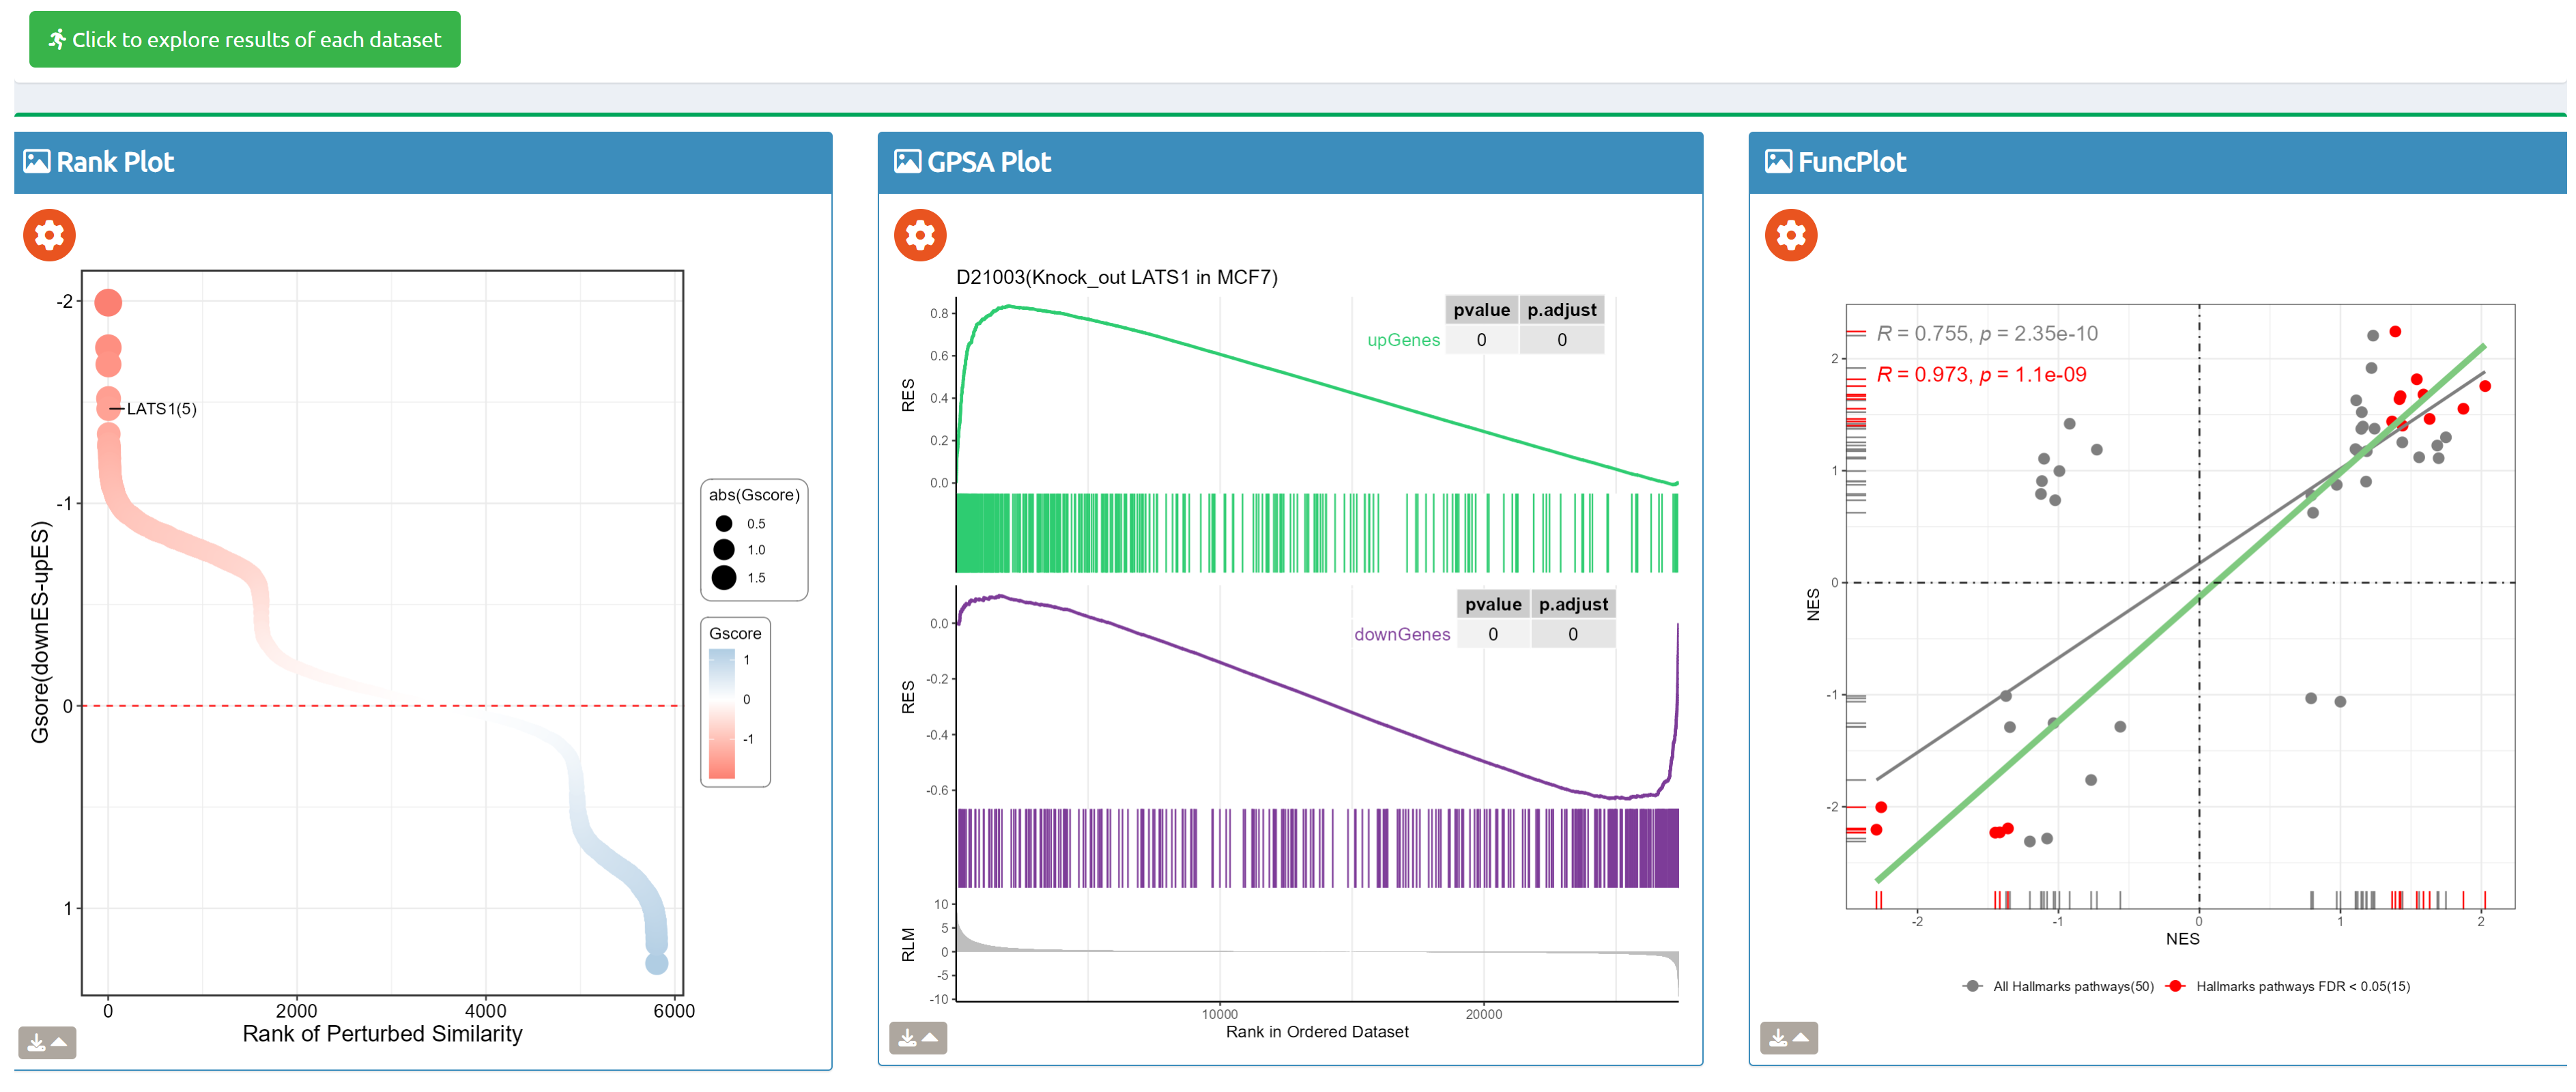
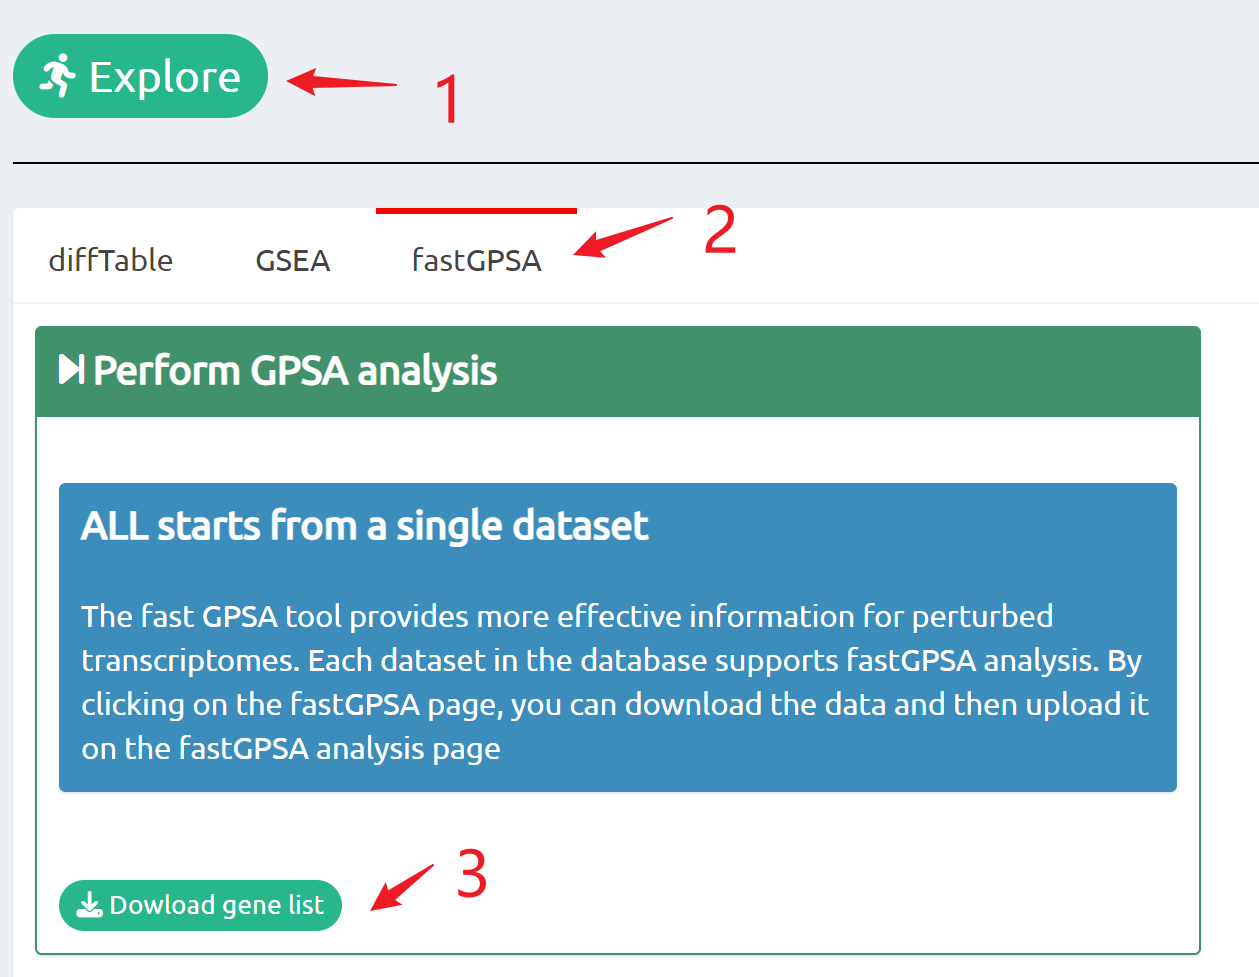
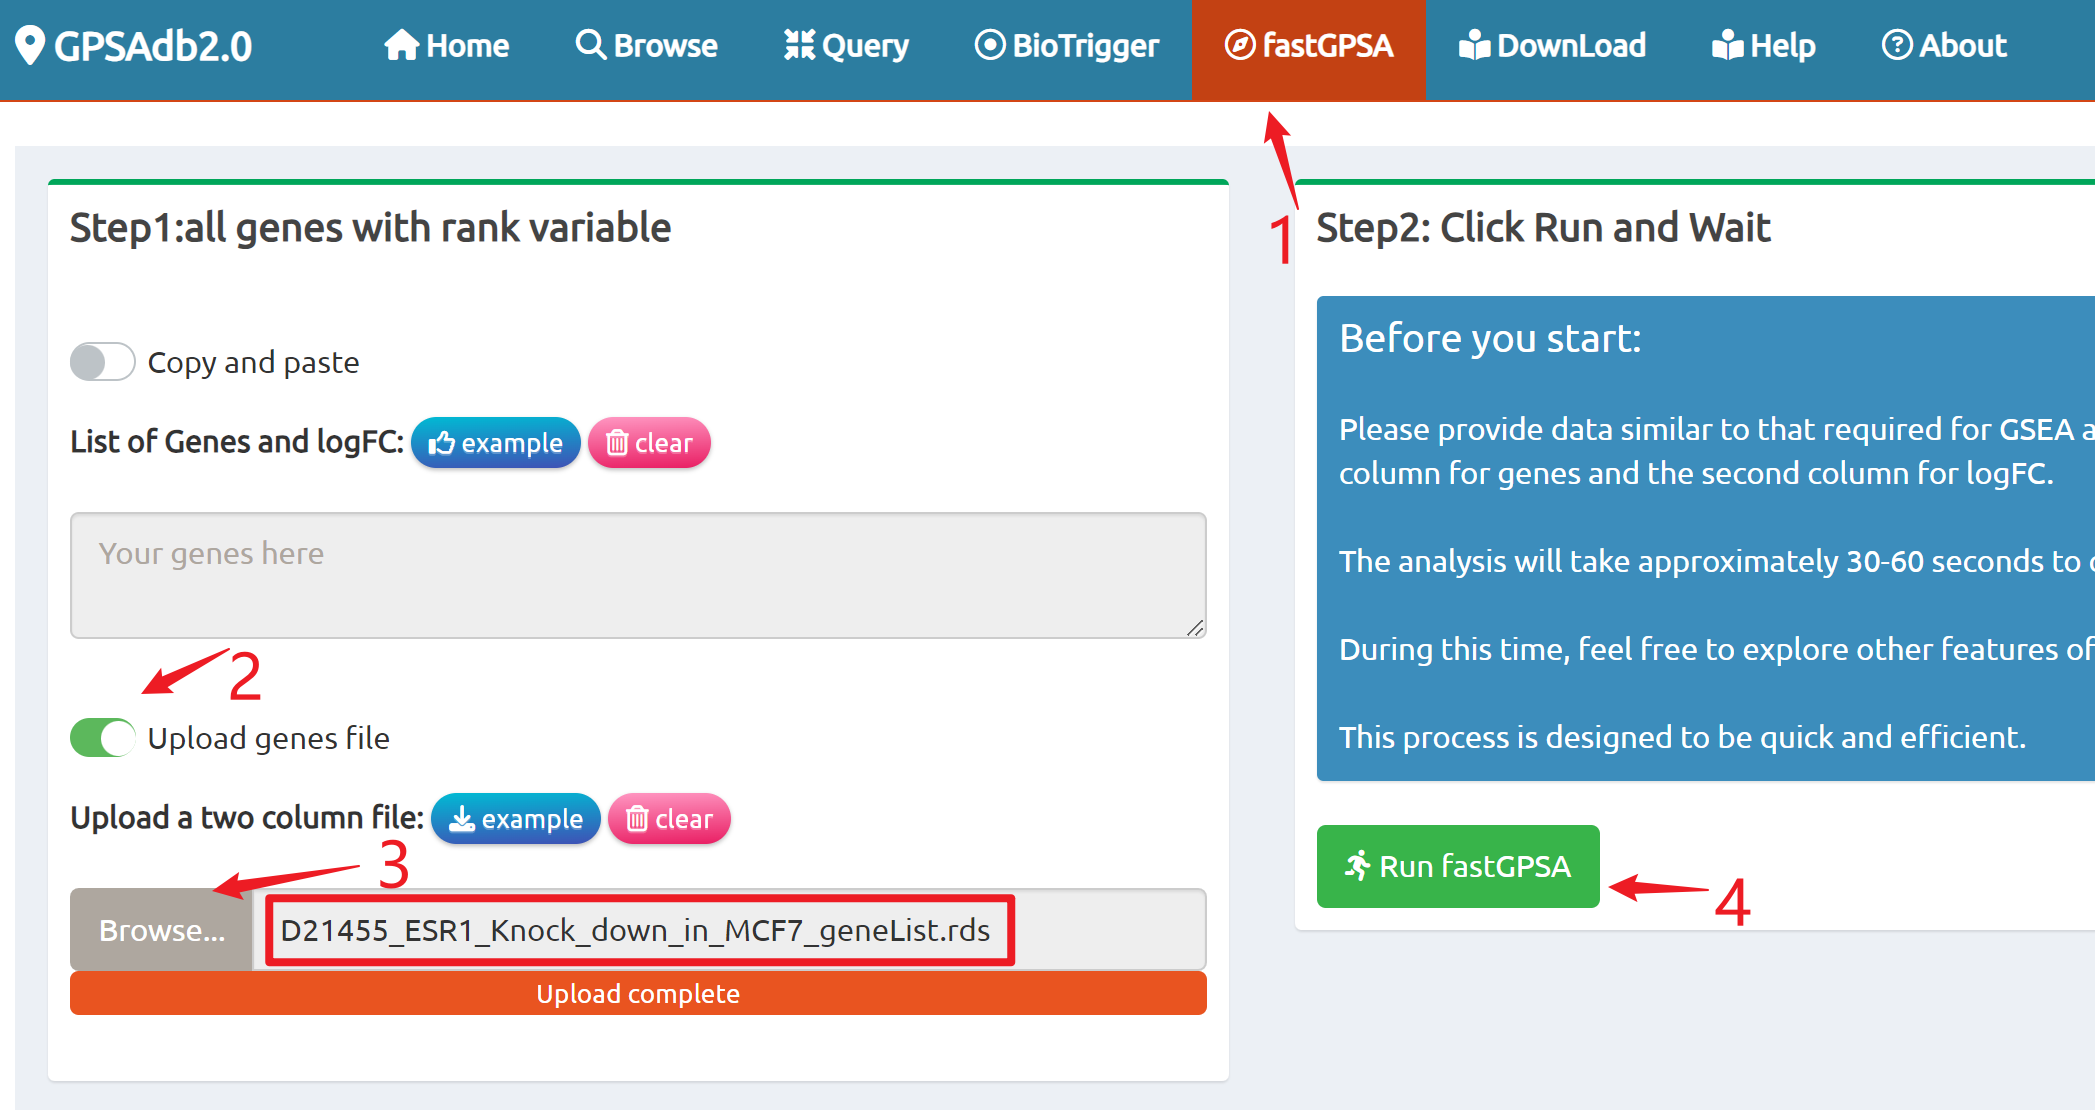
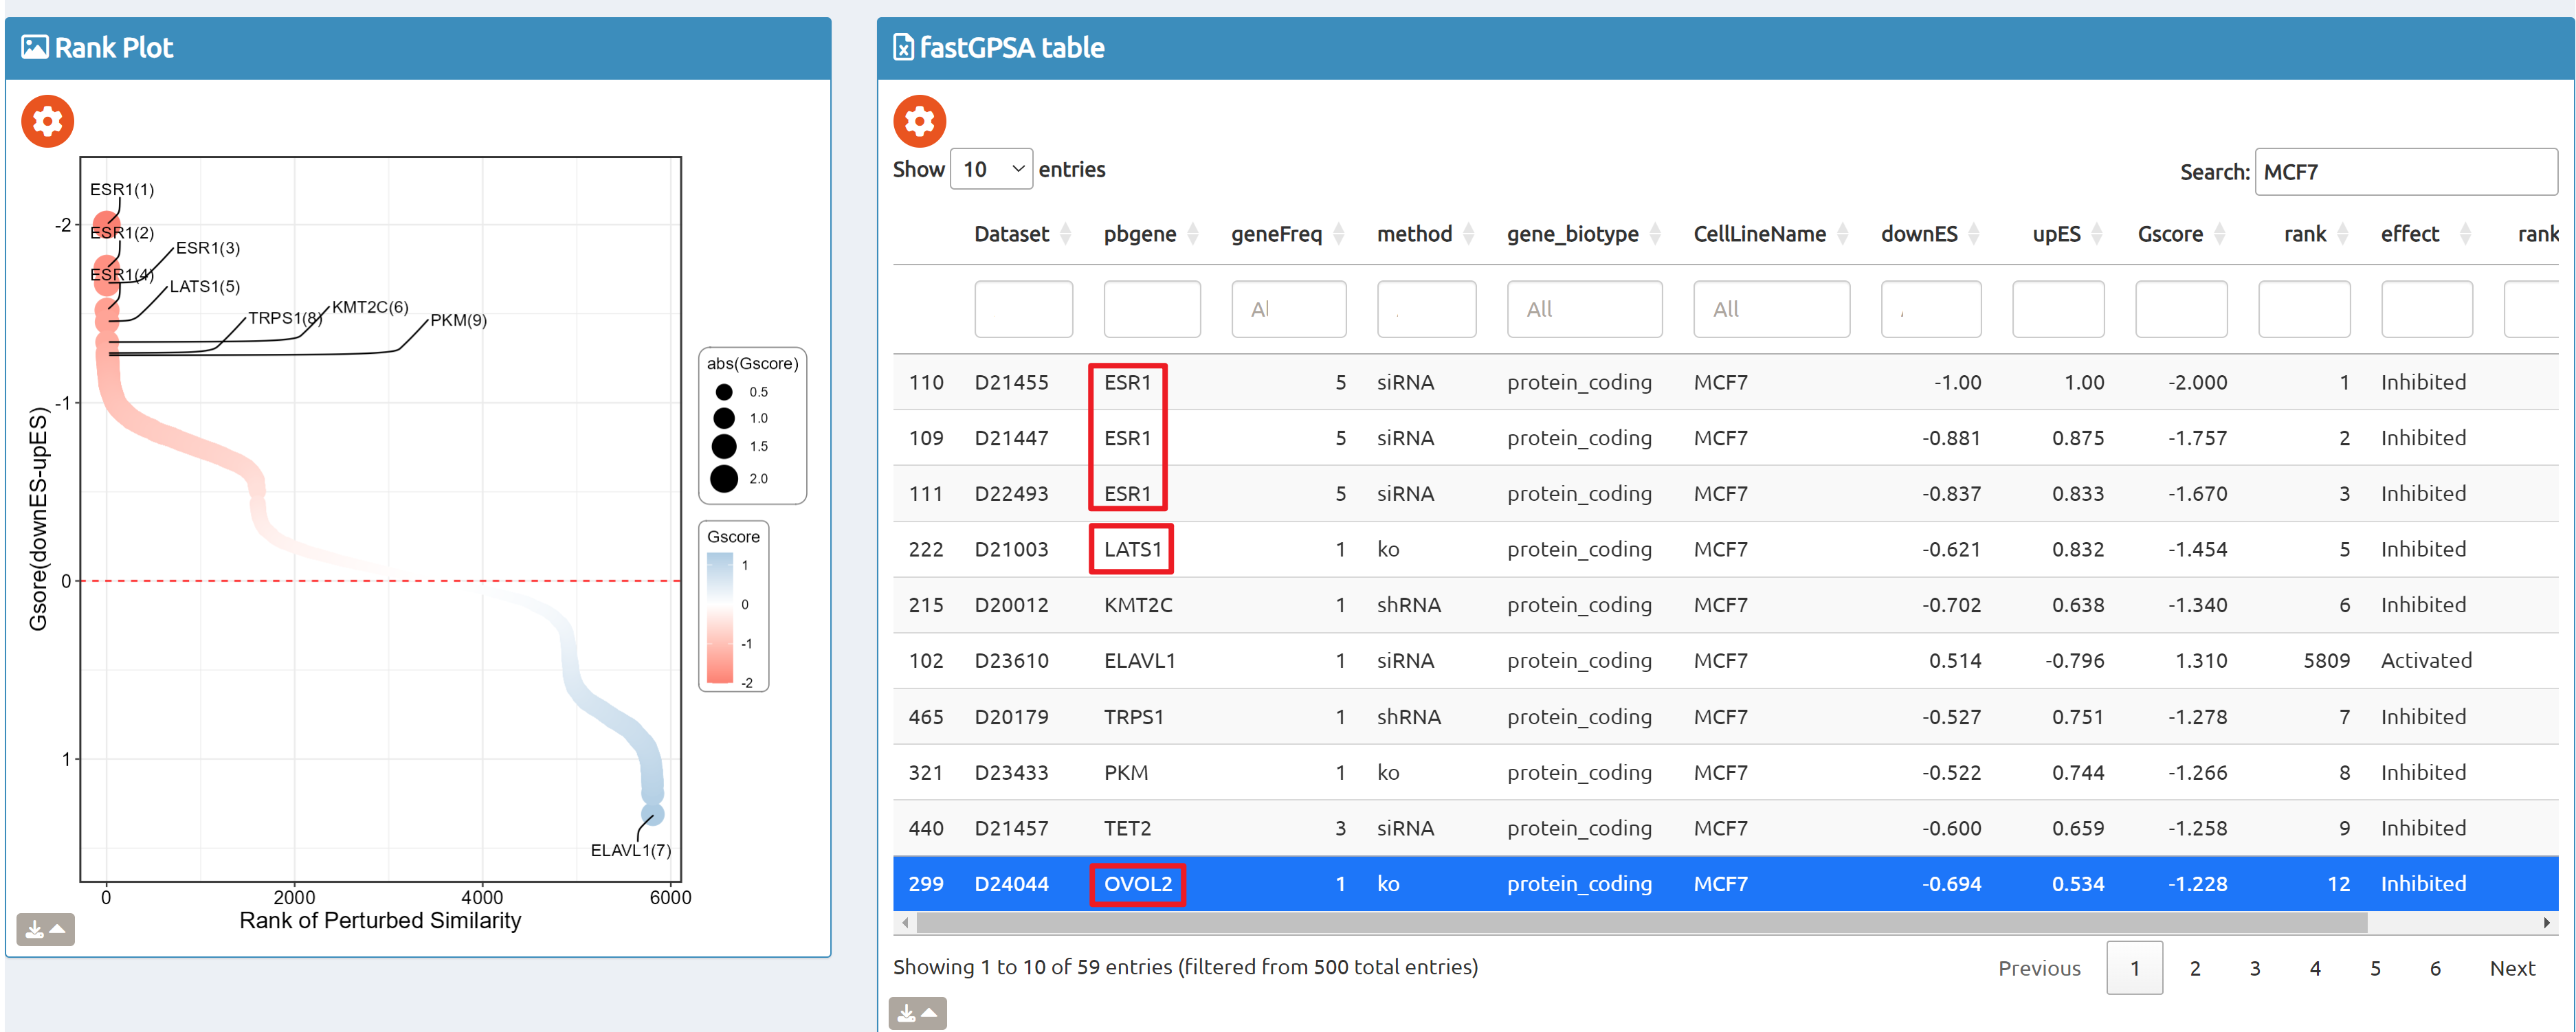
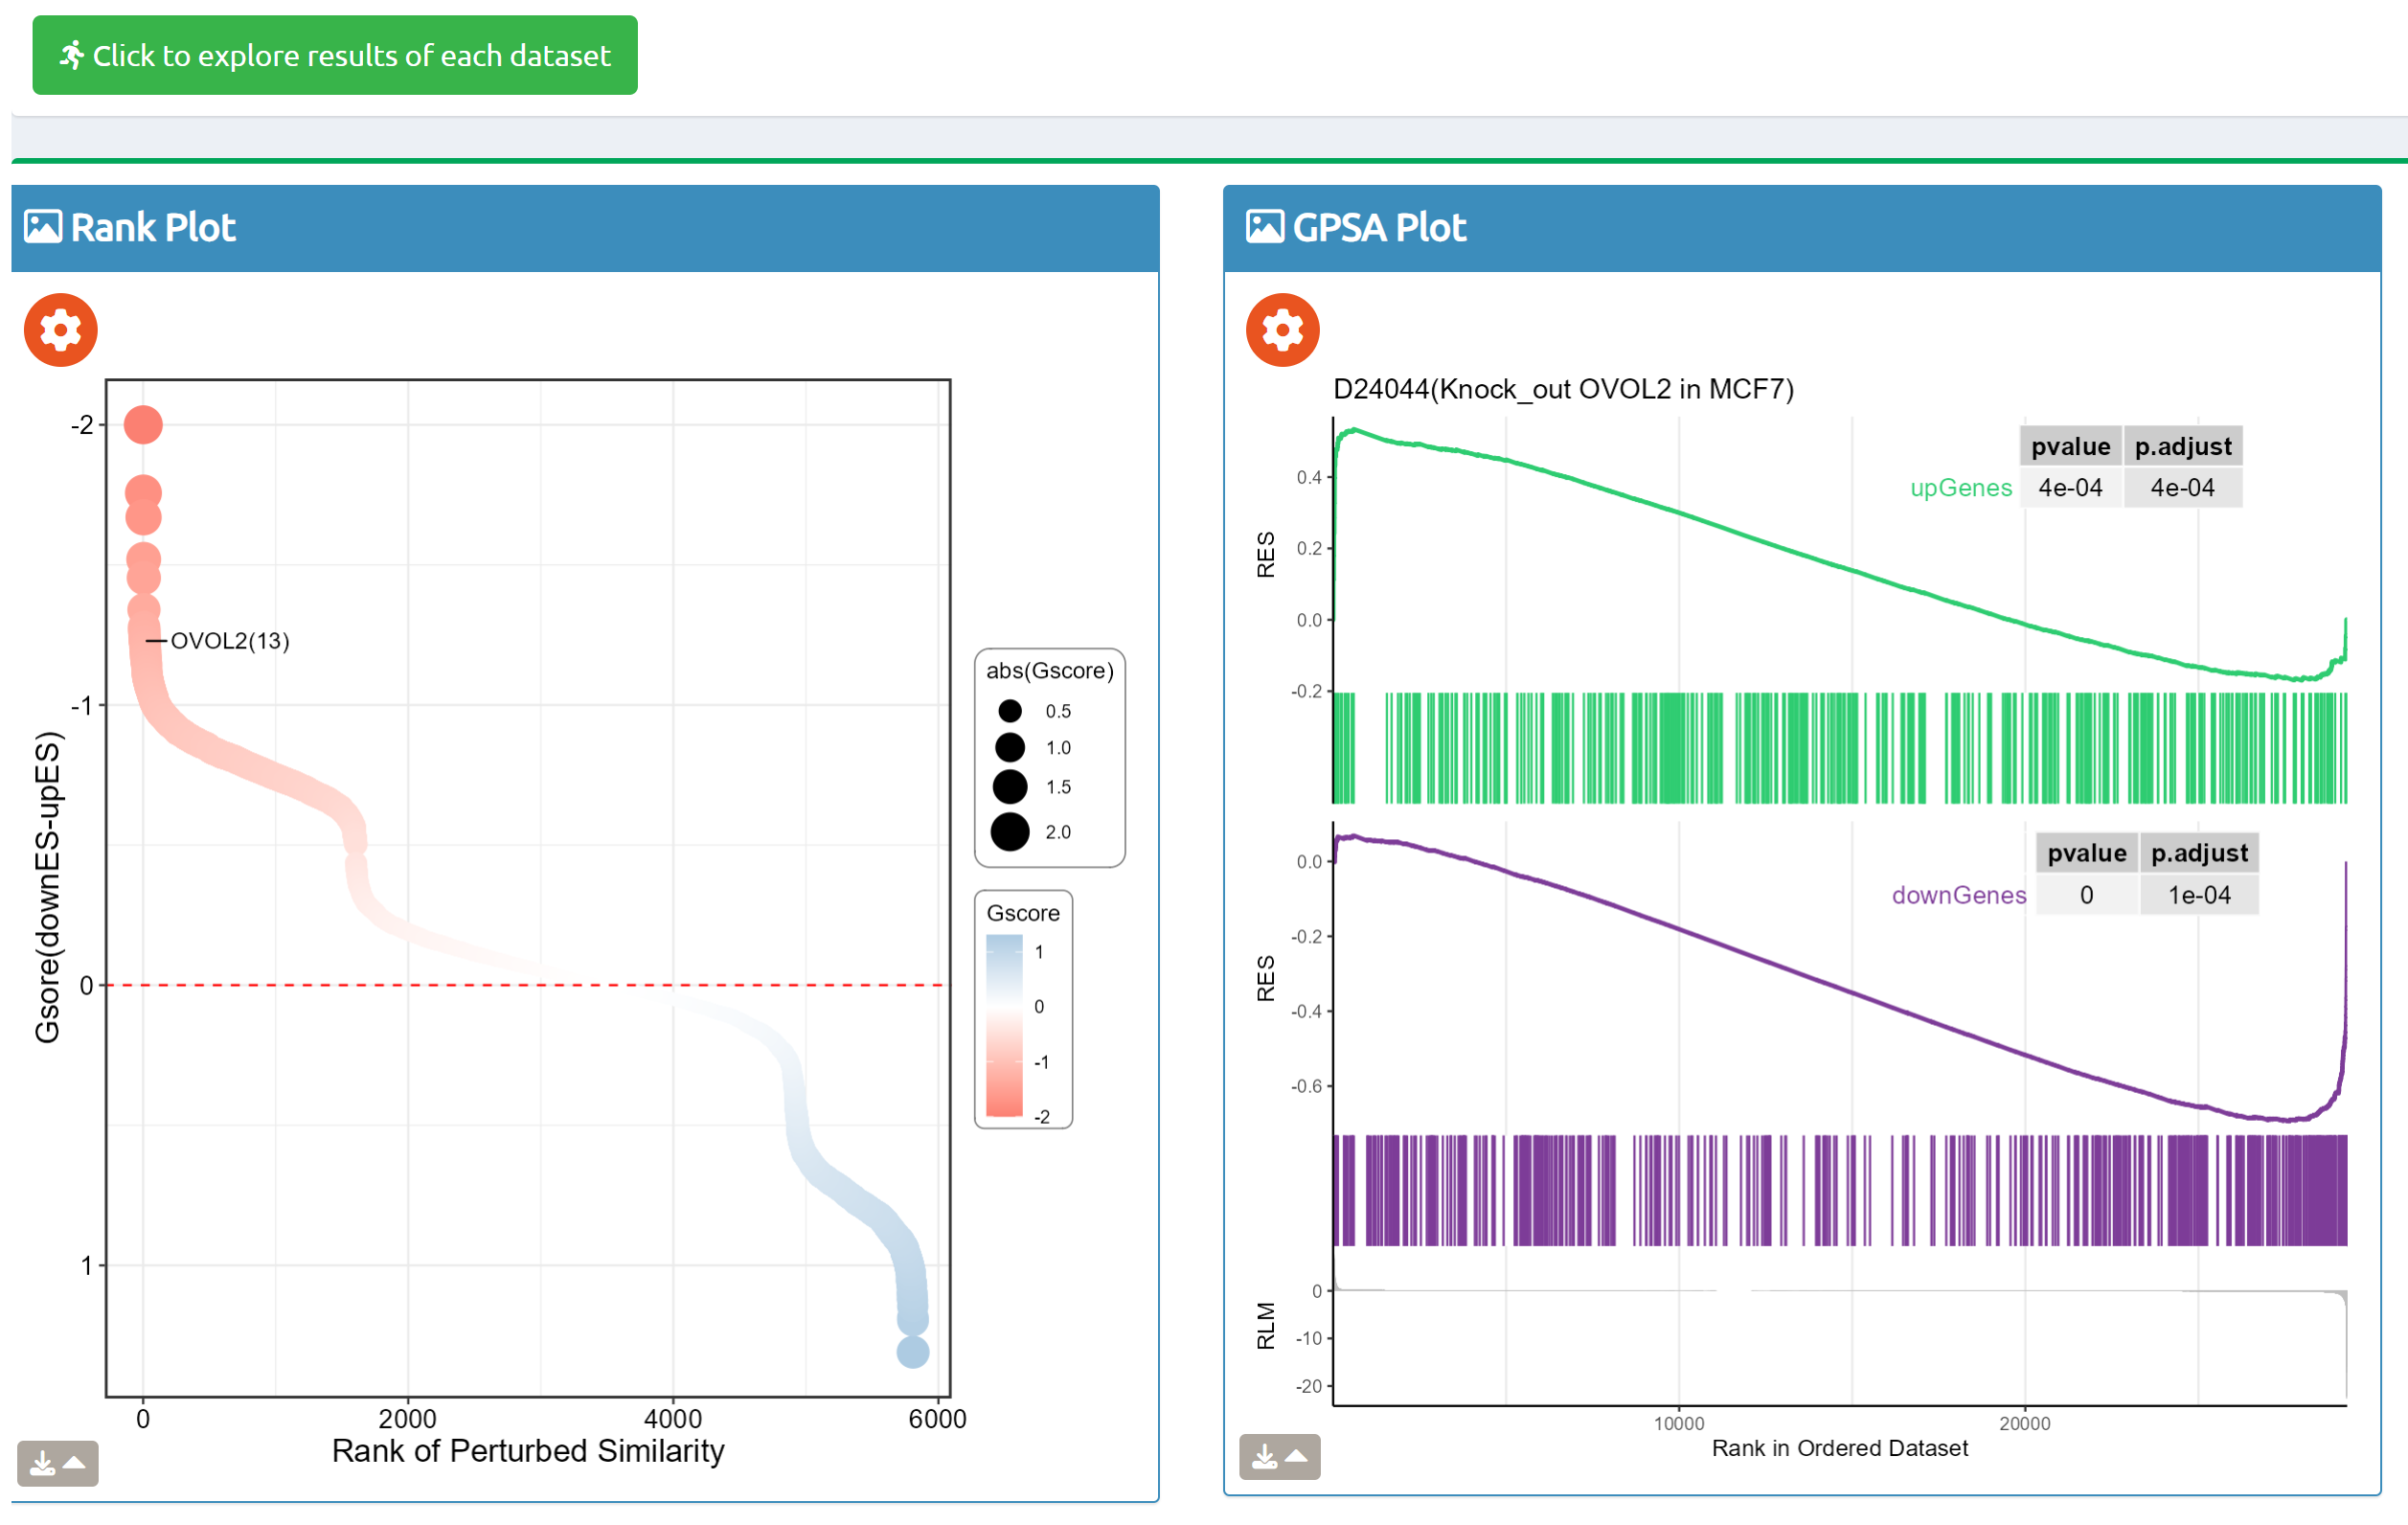
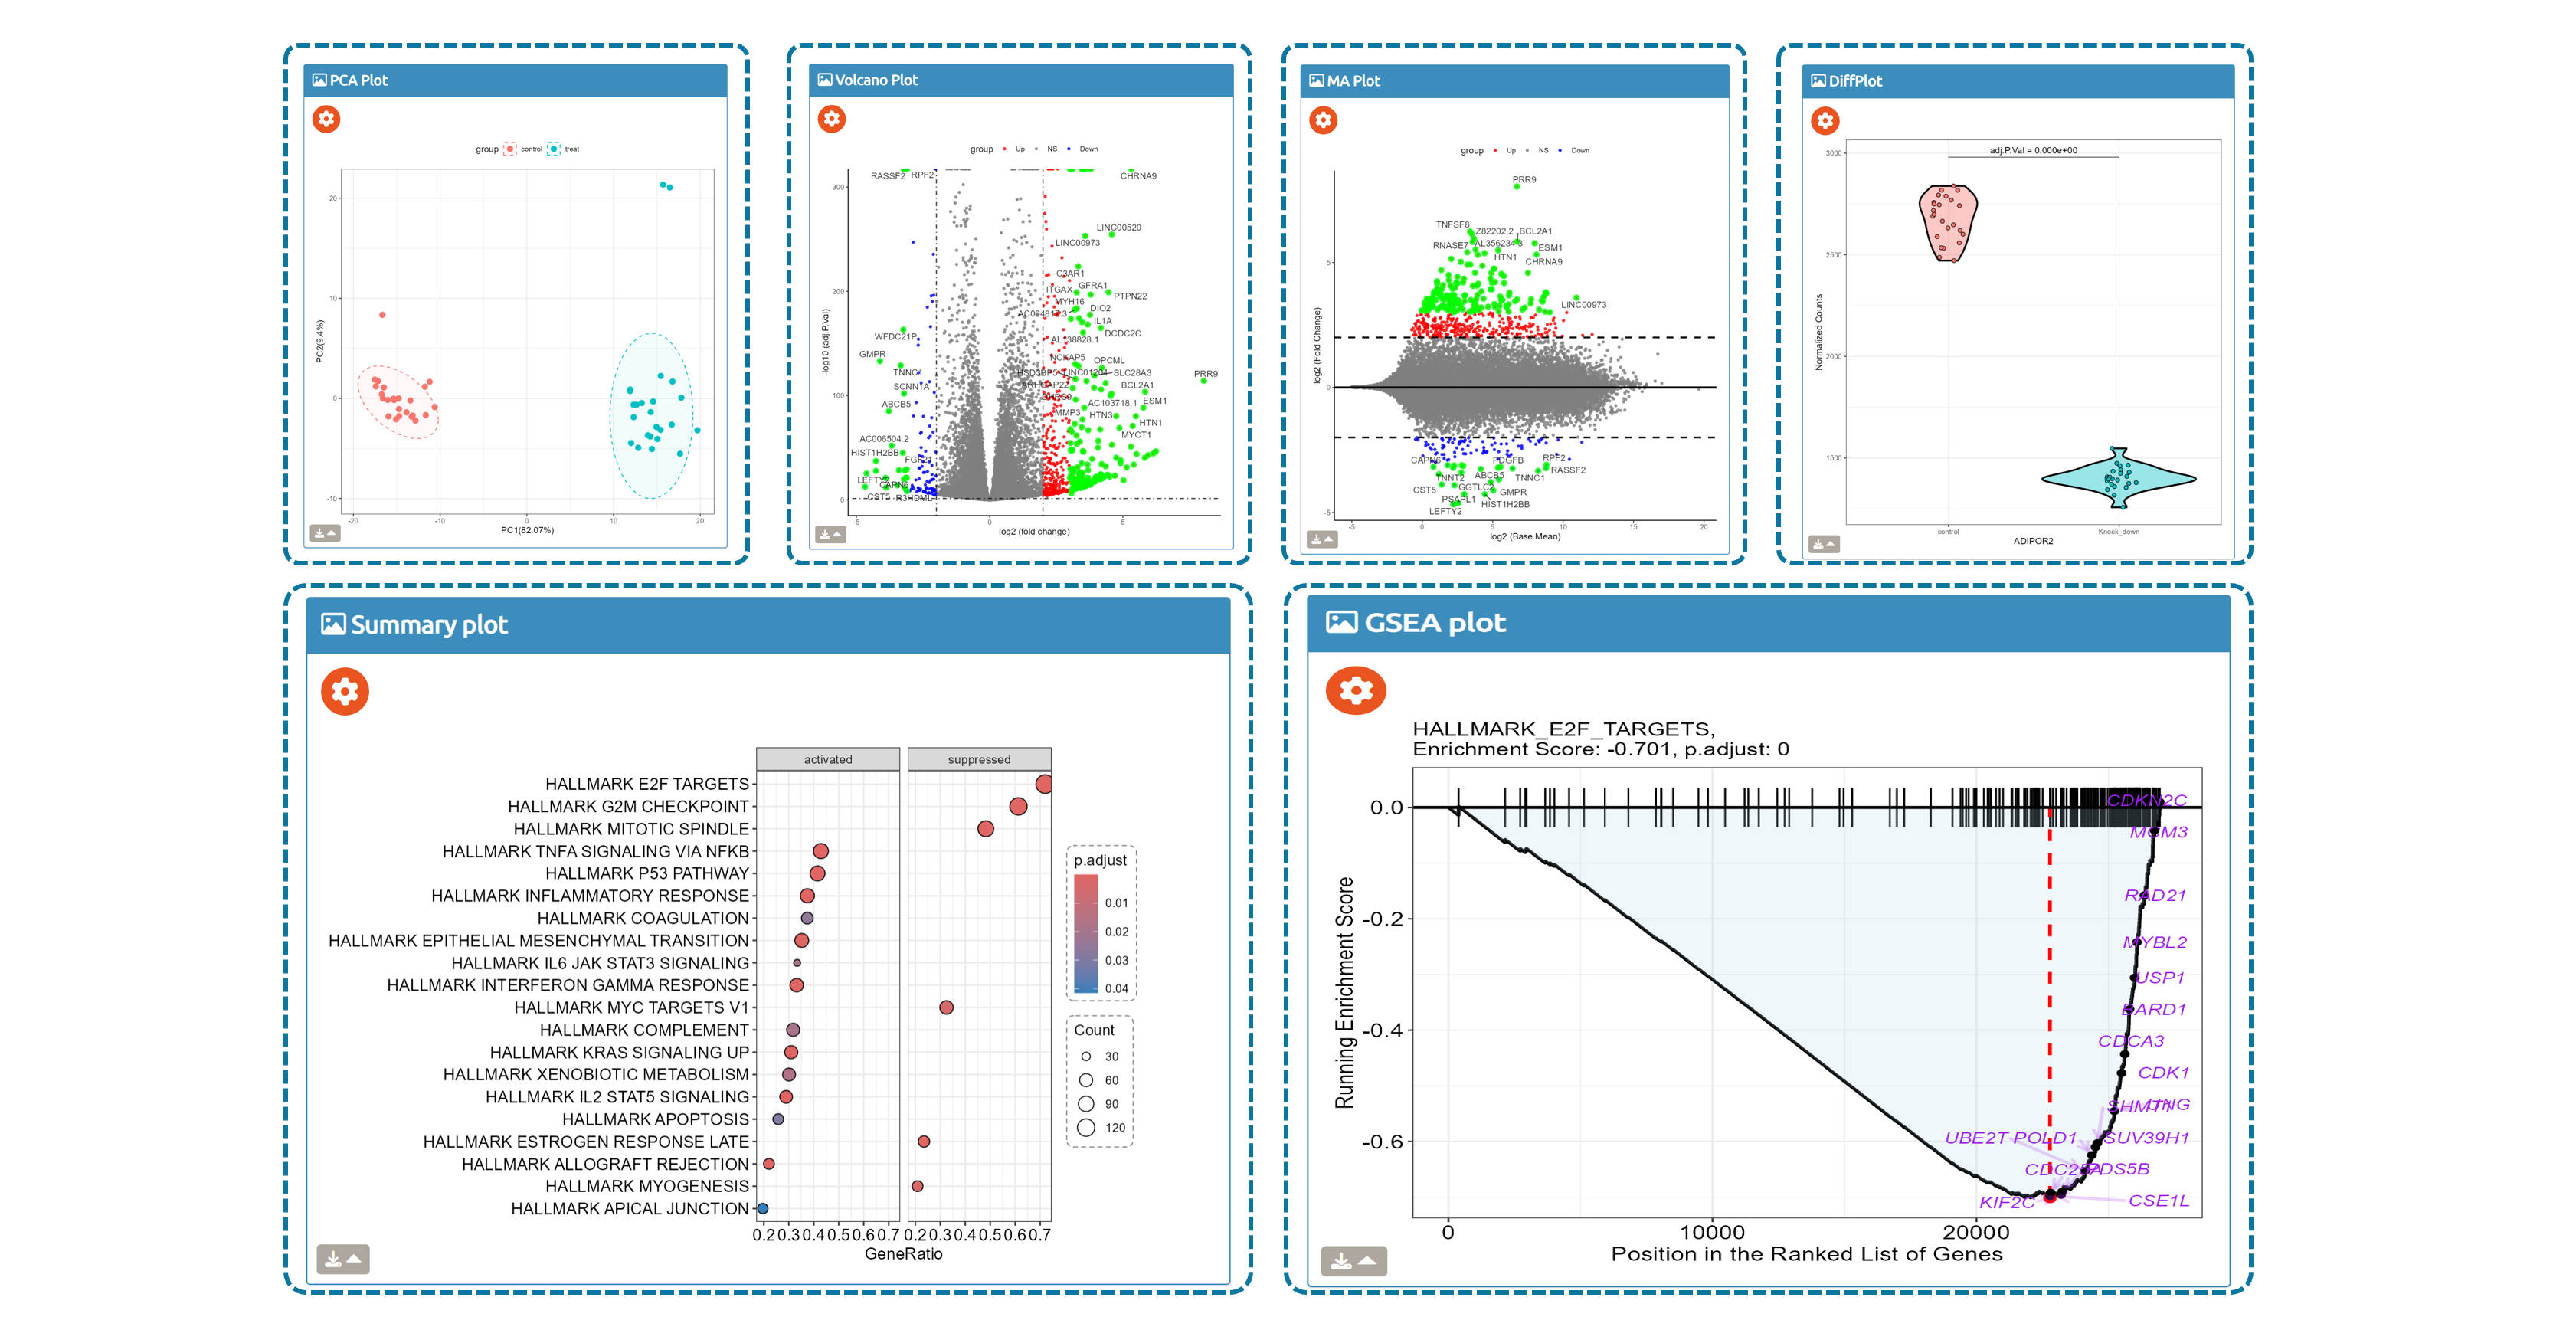
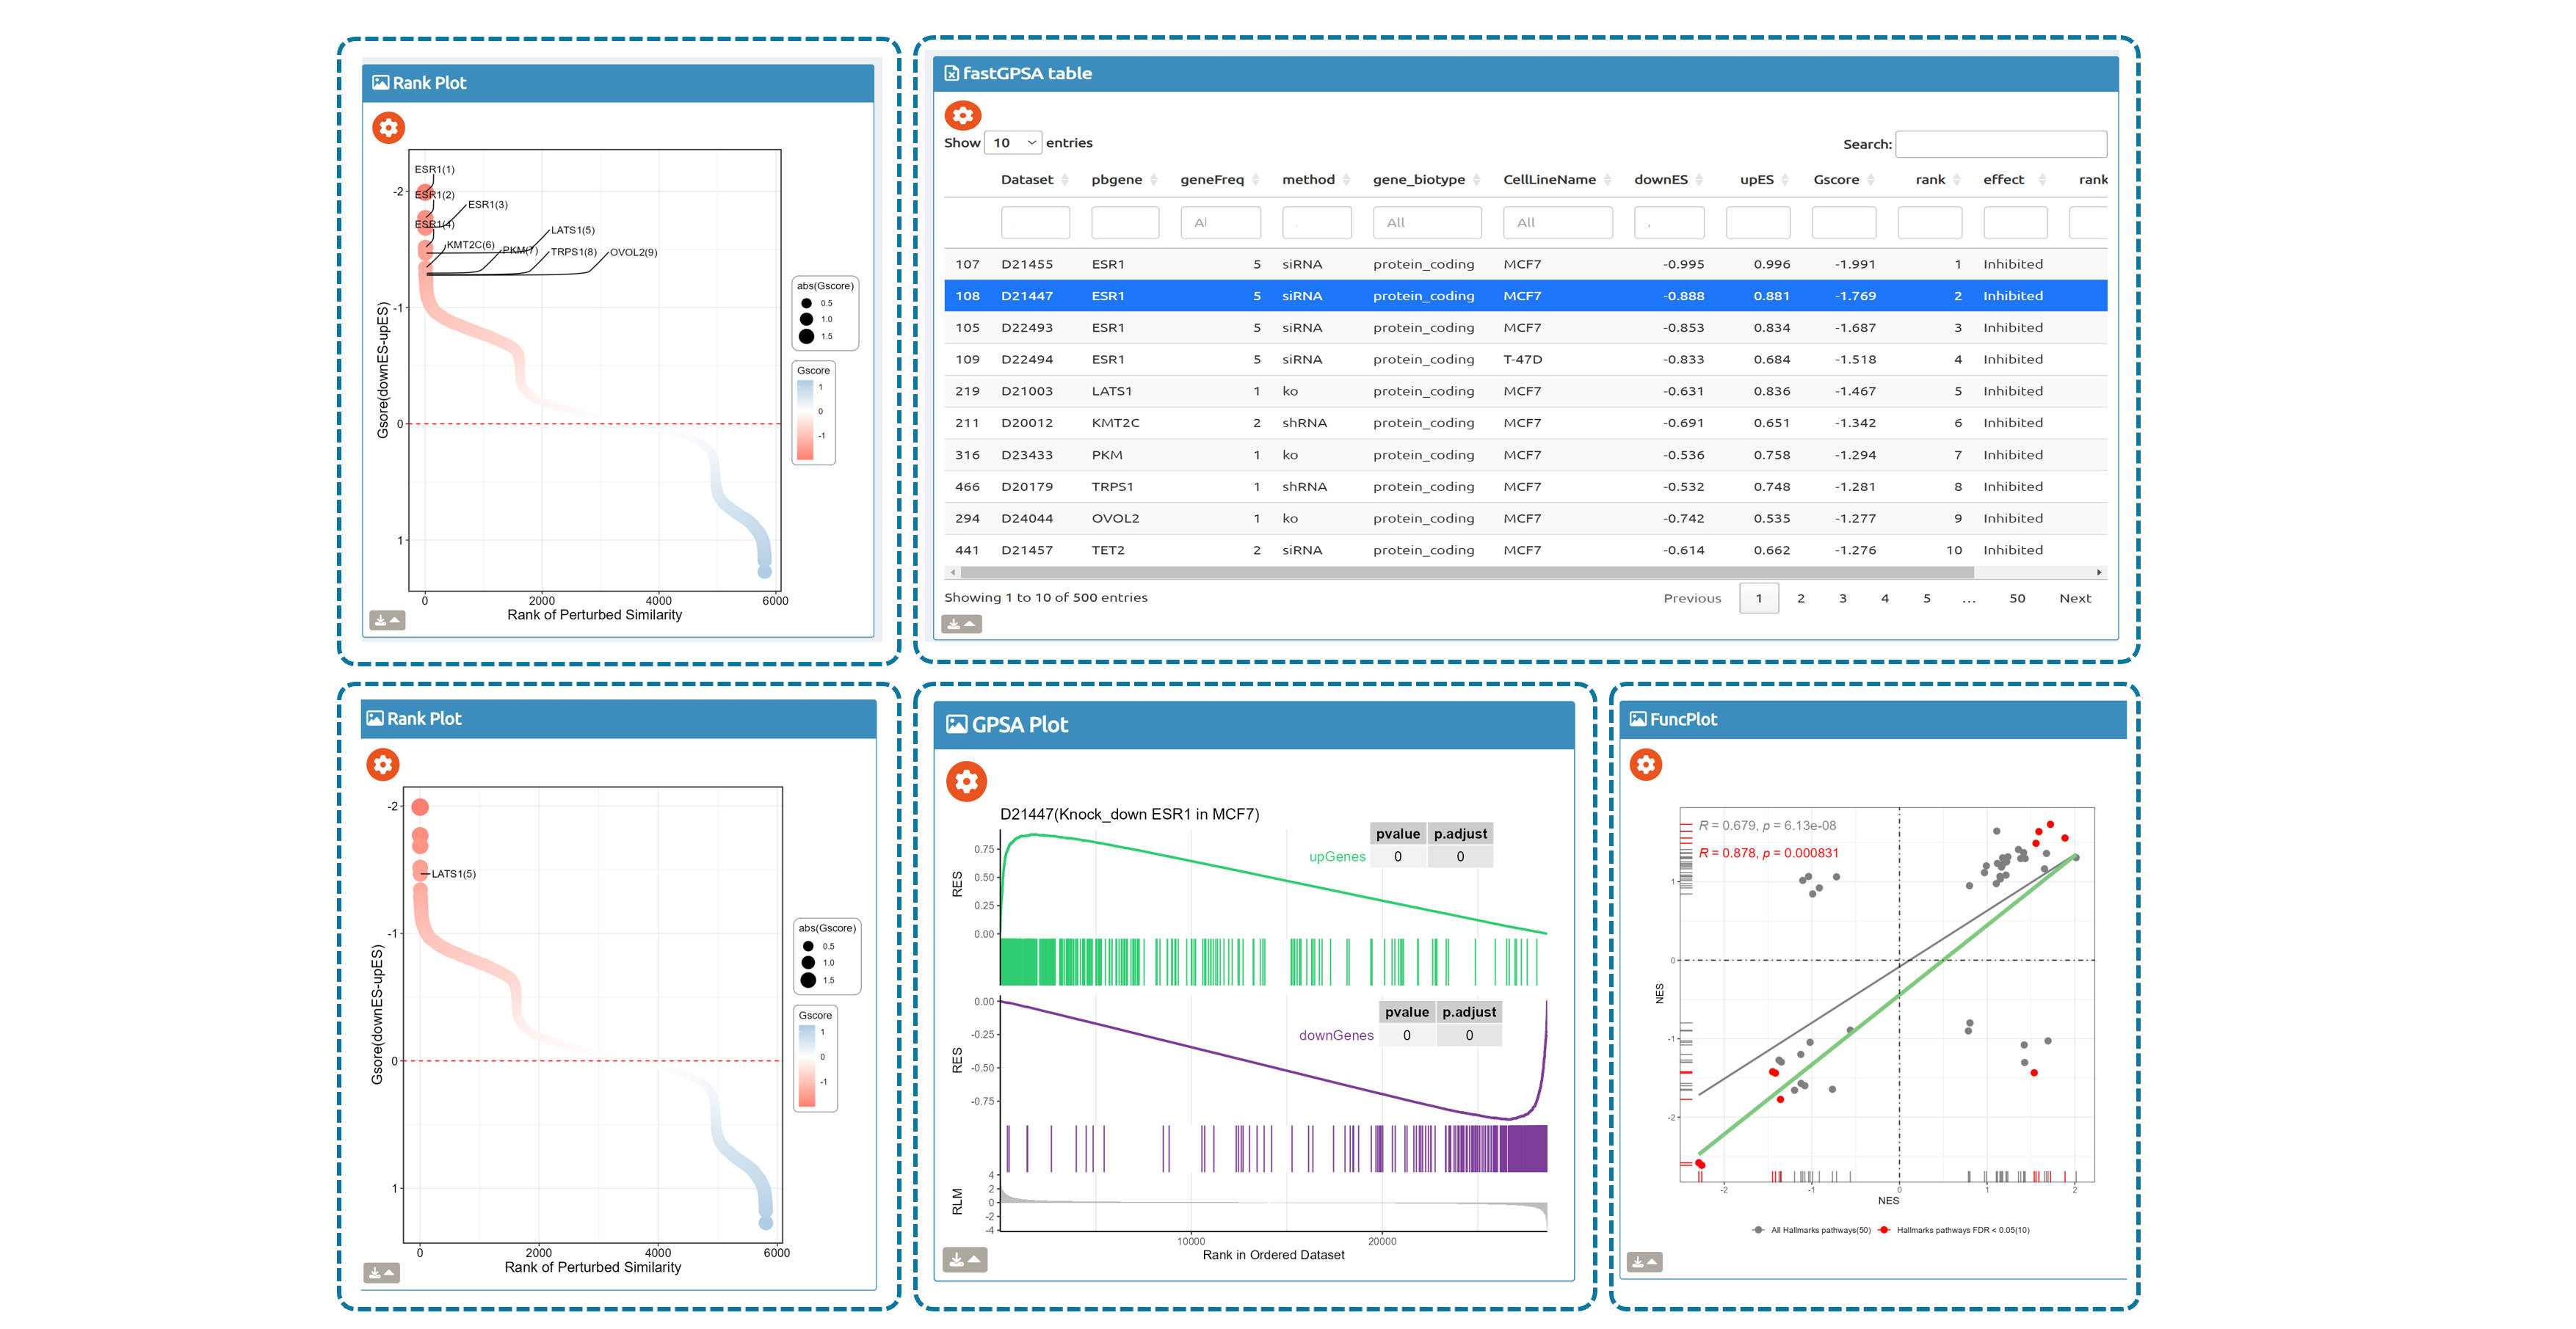
- fastGPSA: Upload a differential-expression table; fastGPSA performs bidirectional enrichment (up/down) and ranks matched perturbations via a G-score, with interactive visuals (Rank Plot, GPSAPlot).
- Reproducible results: One-click access to datasets, consolidated downloads, and step-by-step case studies to guide typical research workflows.
Use cases: Discover regulatory genes, illuminate disease mechanisms, and prioritize potential therapeutic targets from perturbation transcriptomes—quickly, transparently, and at scale.
Browse
7,665 datasets to explore
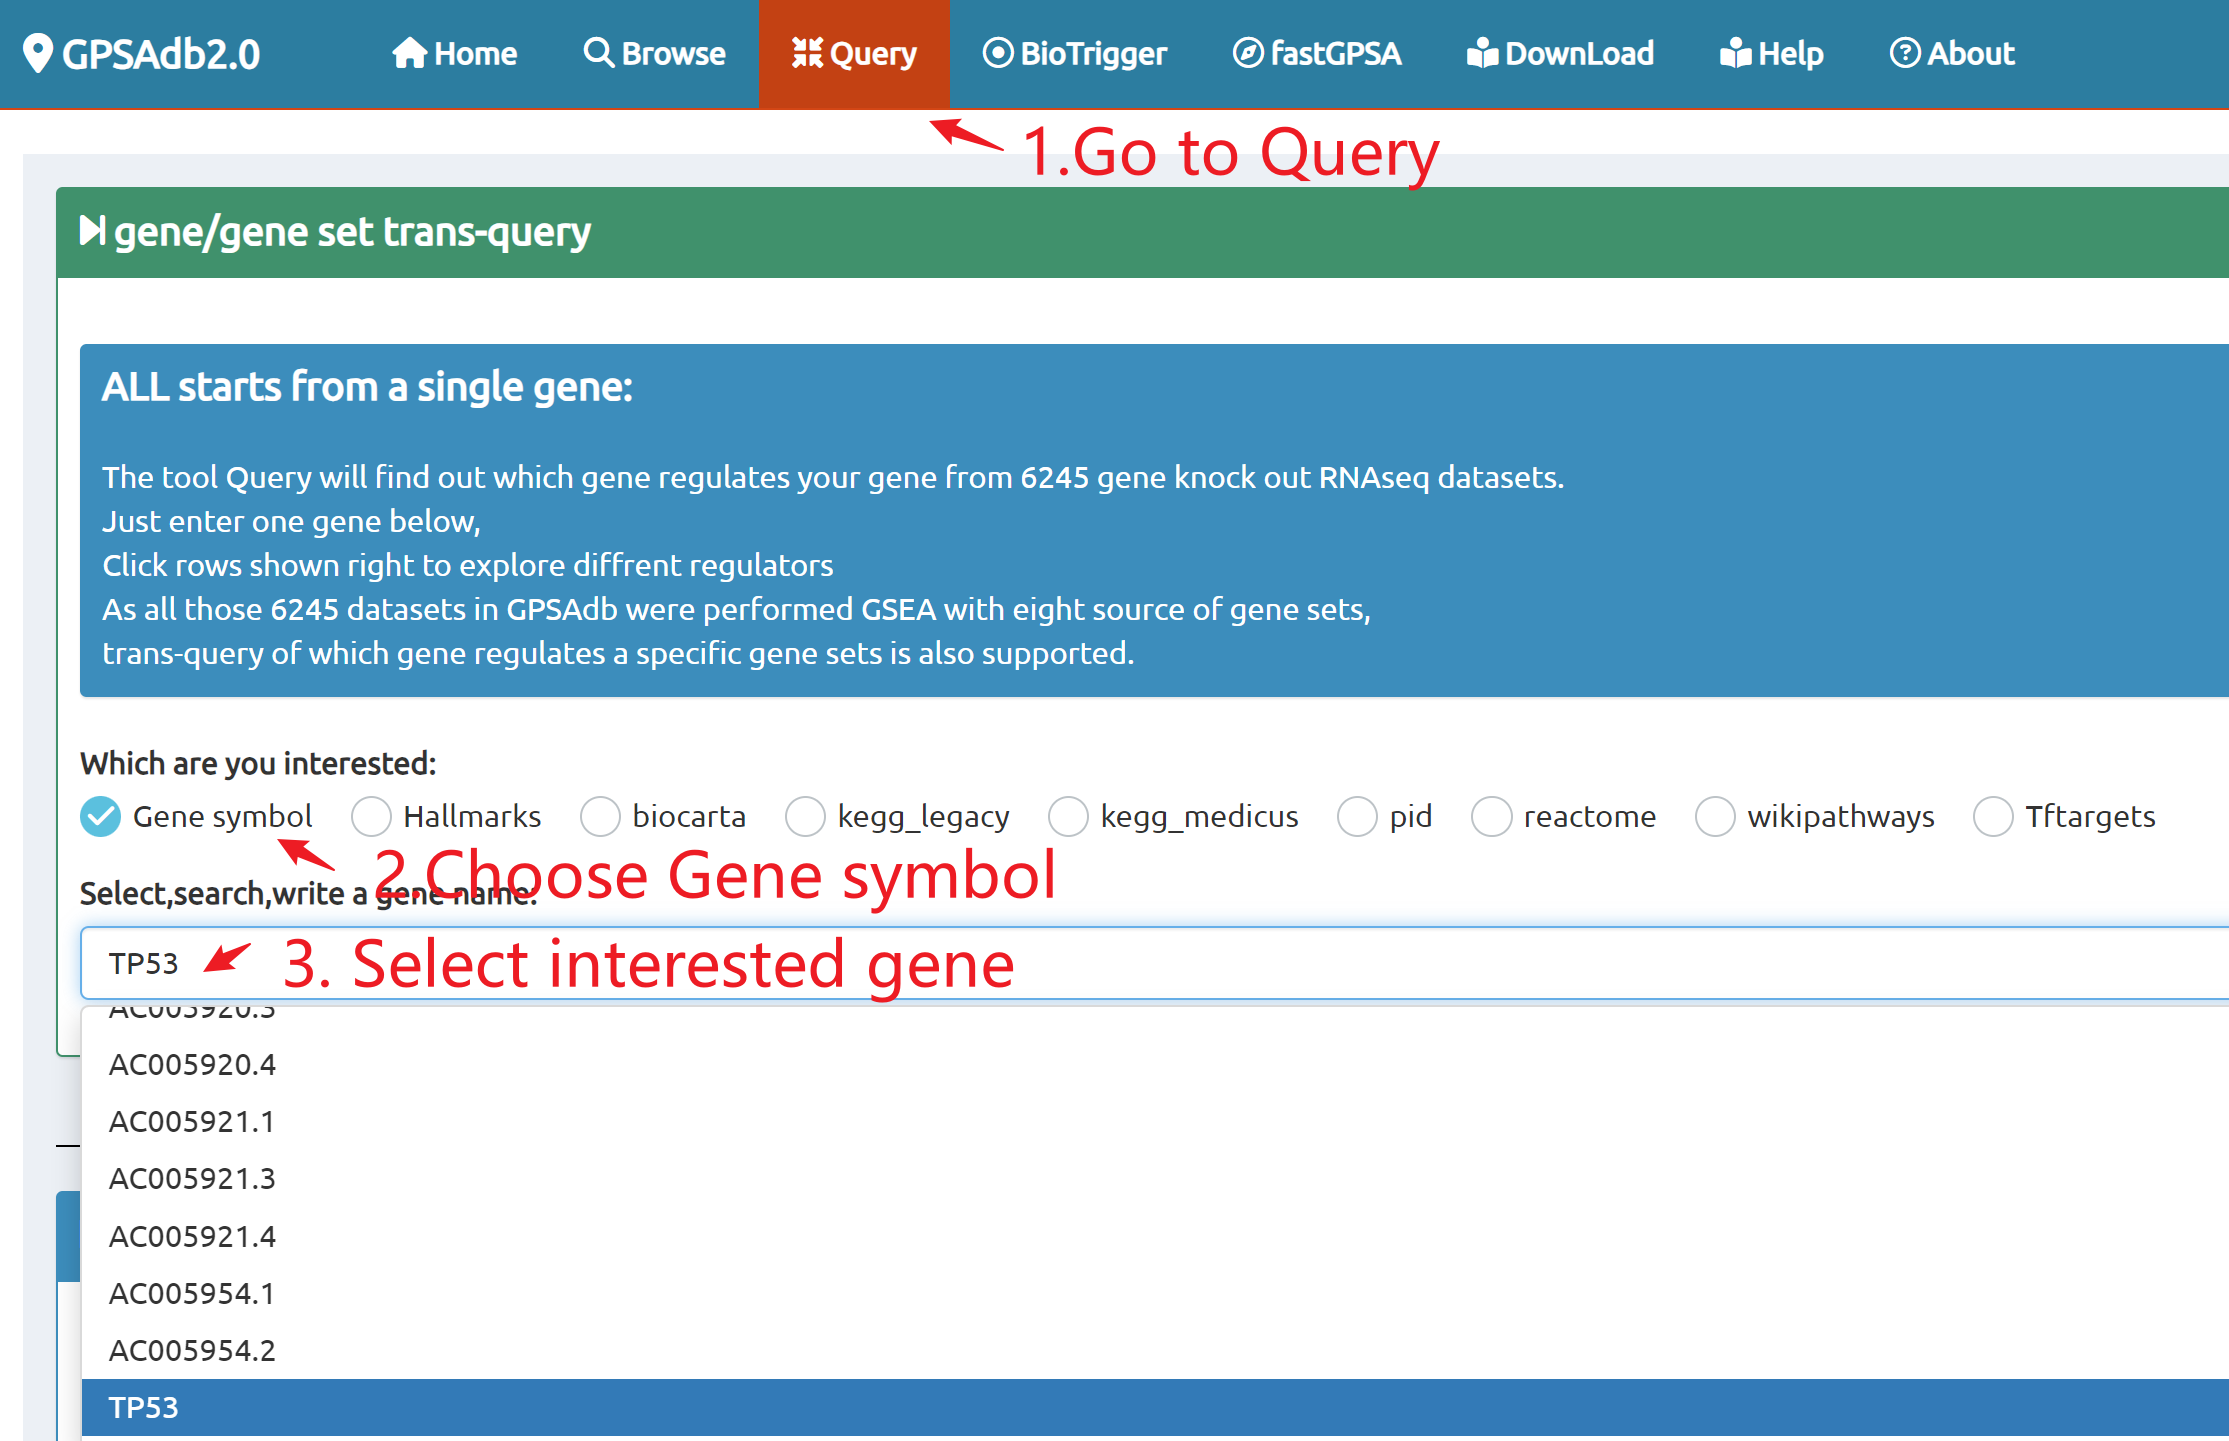
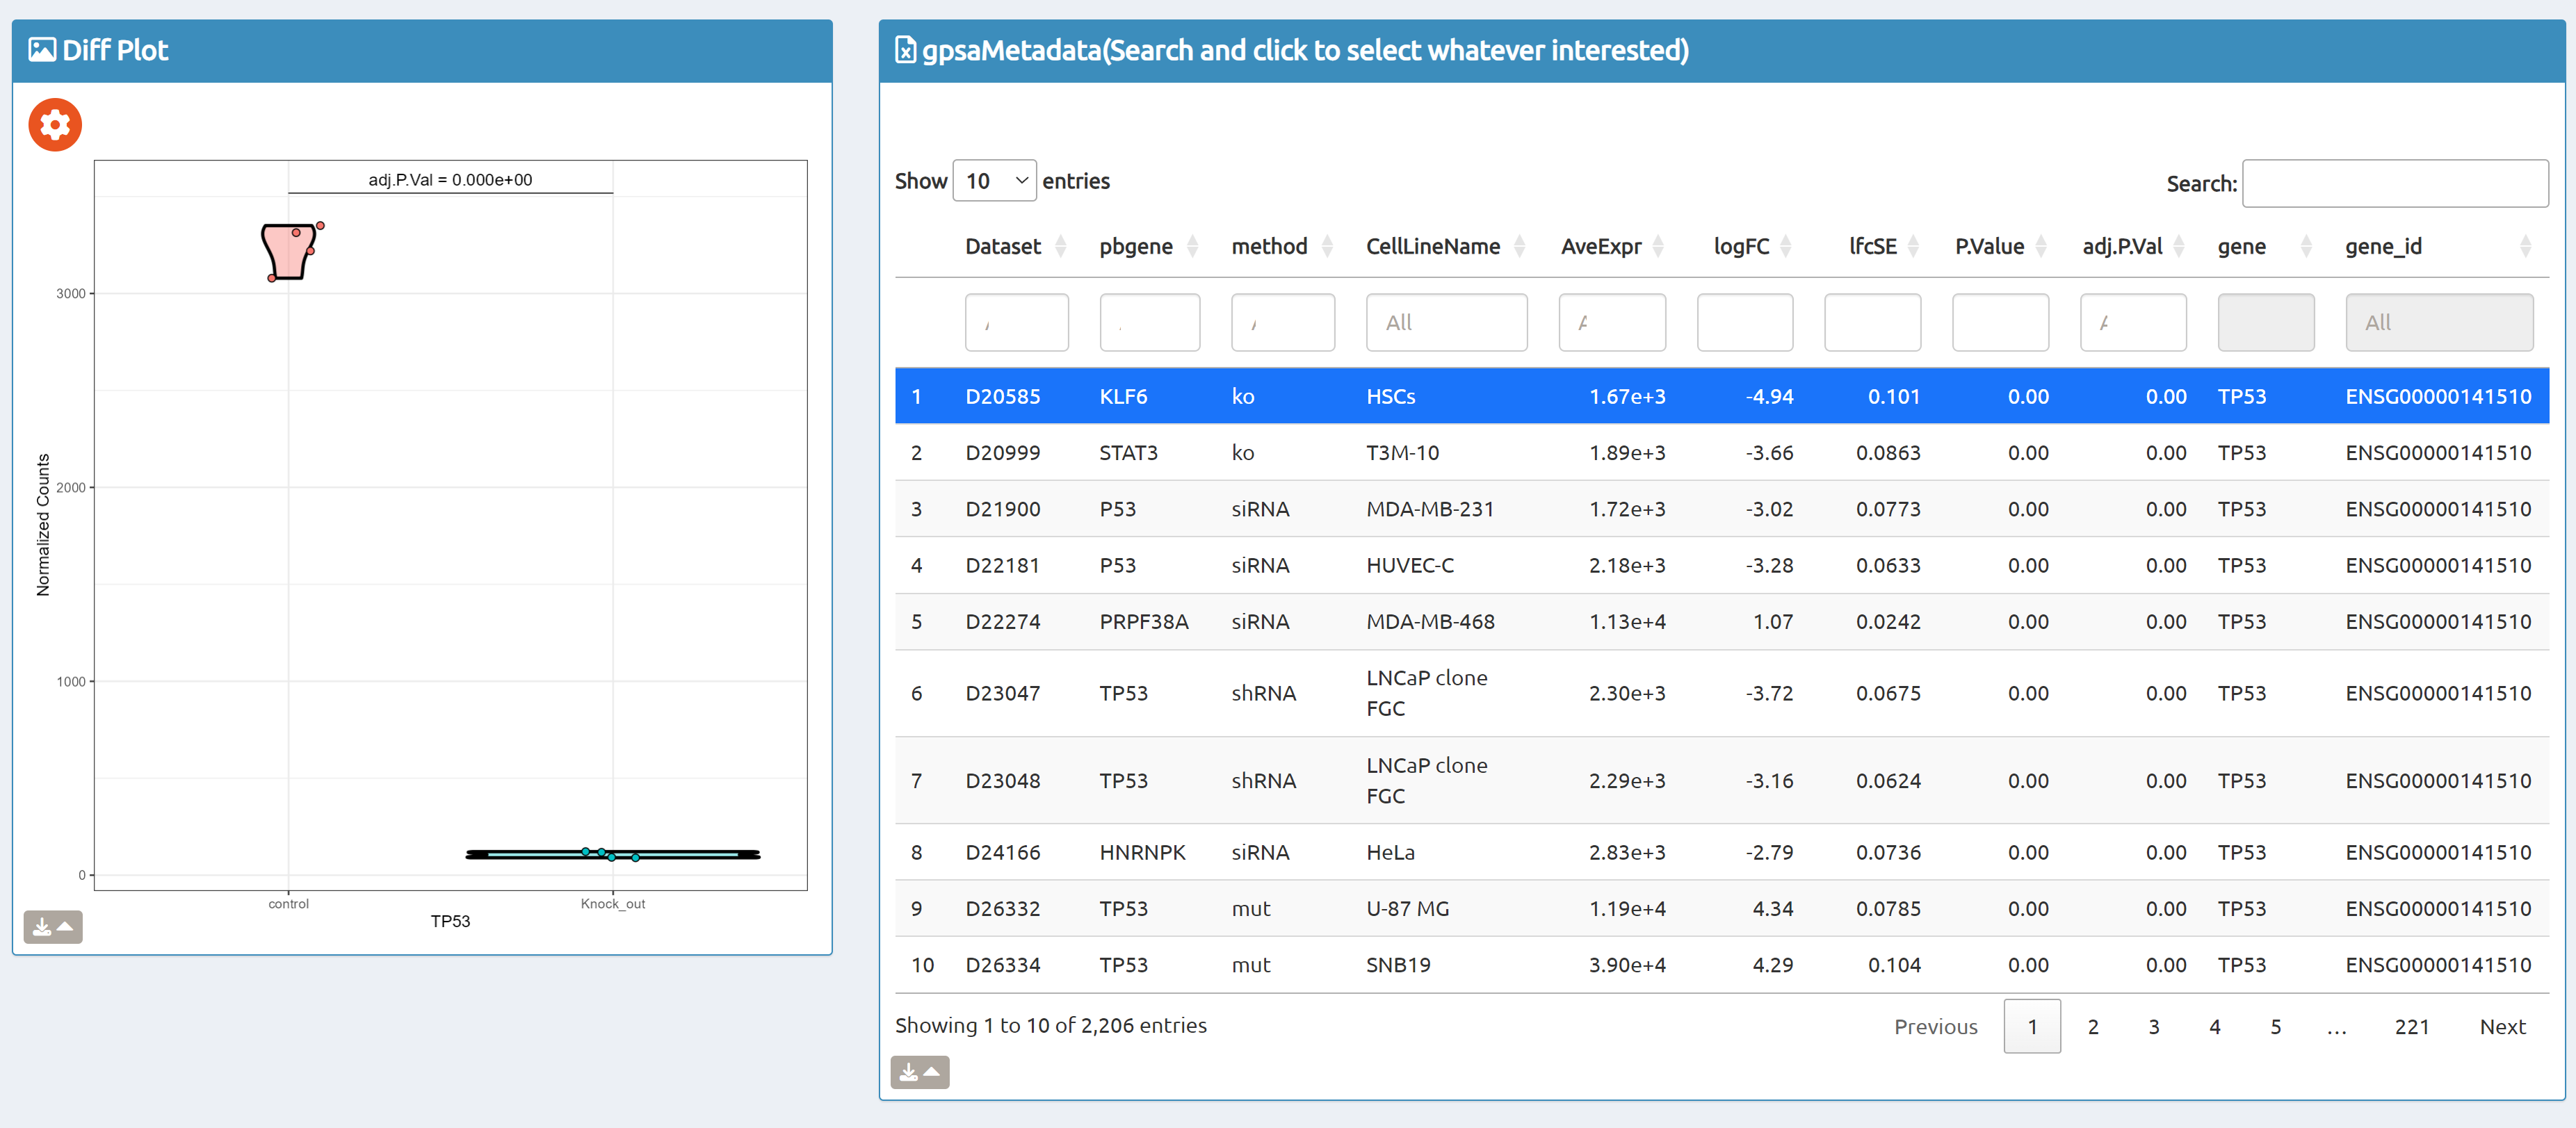
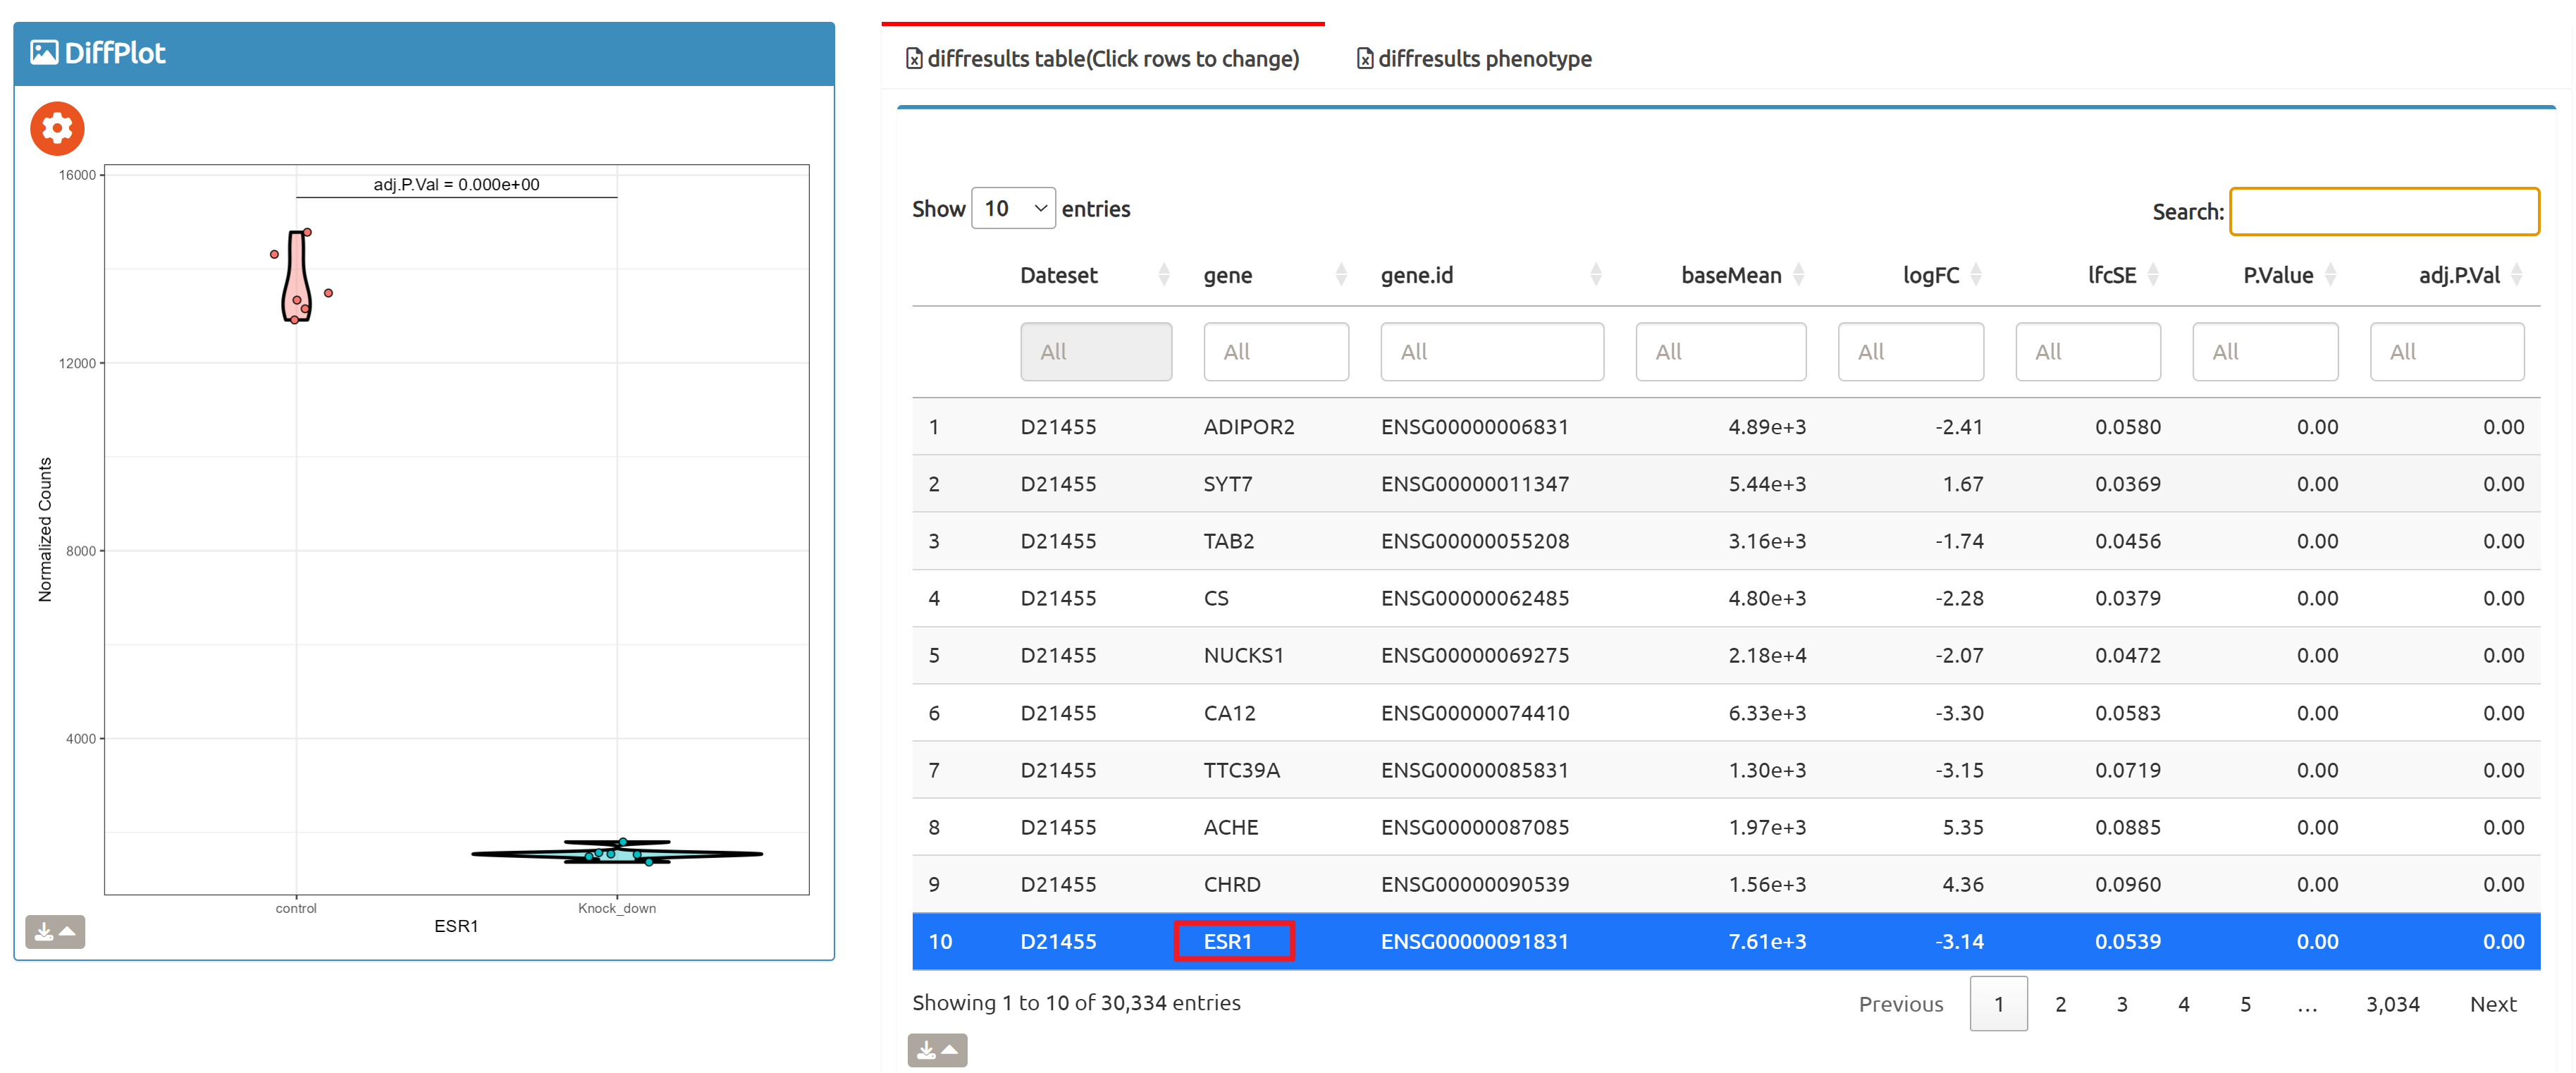
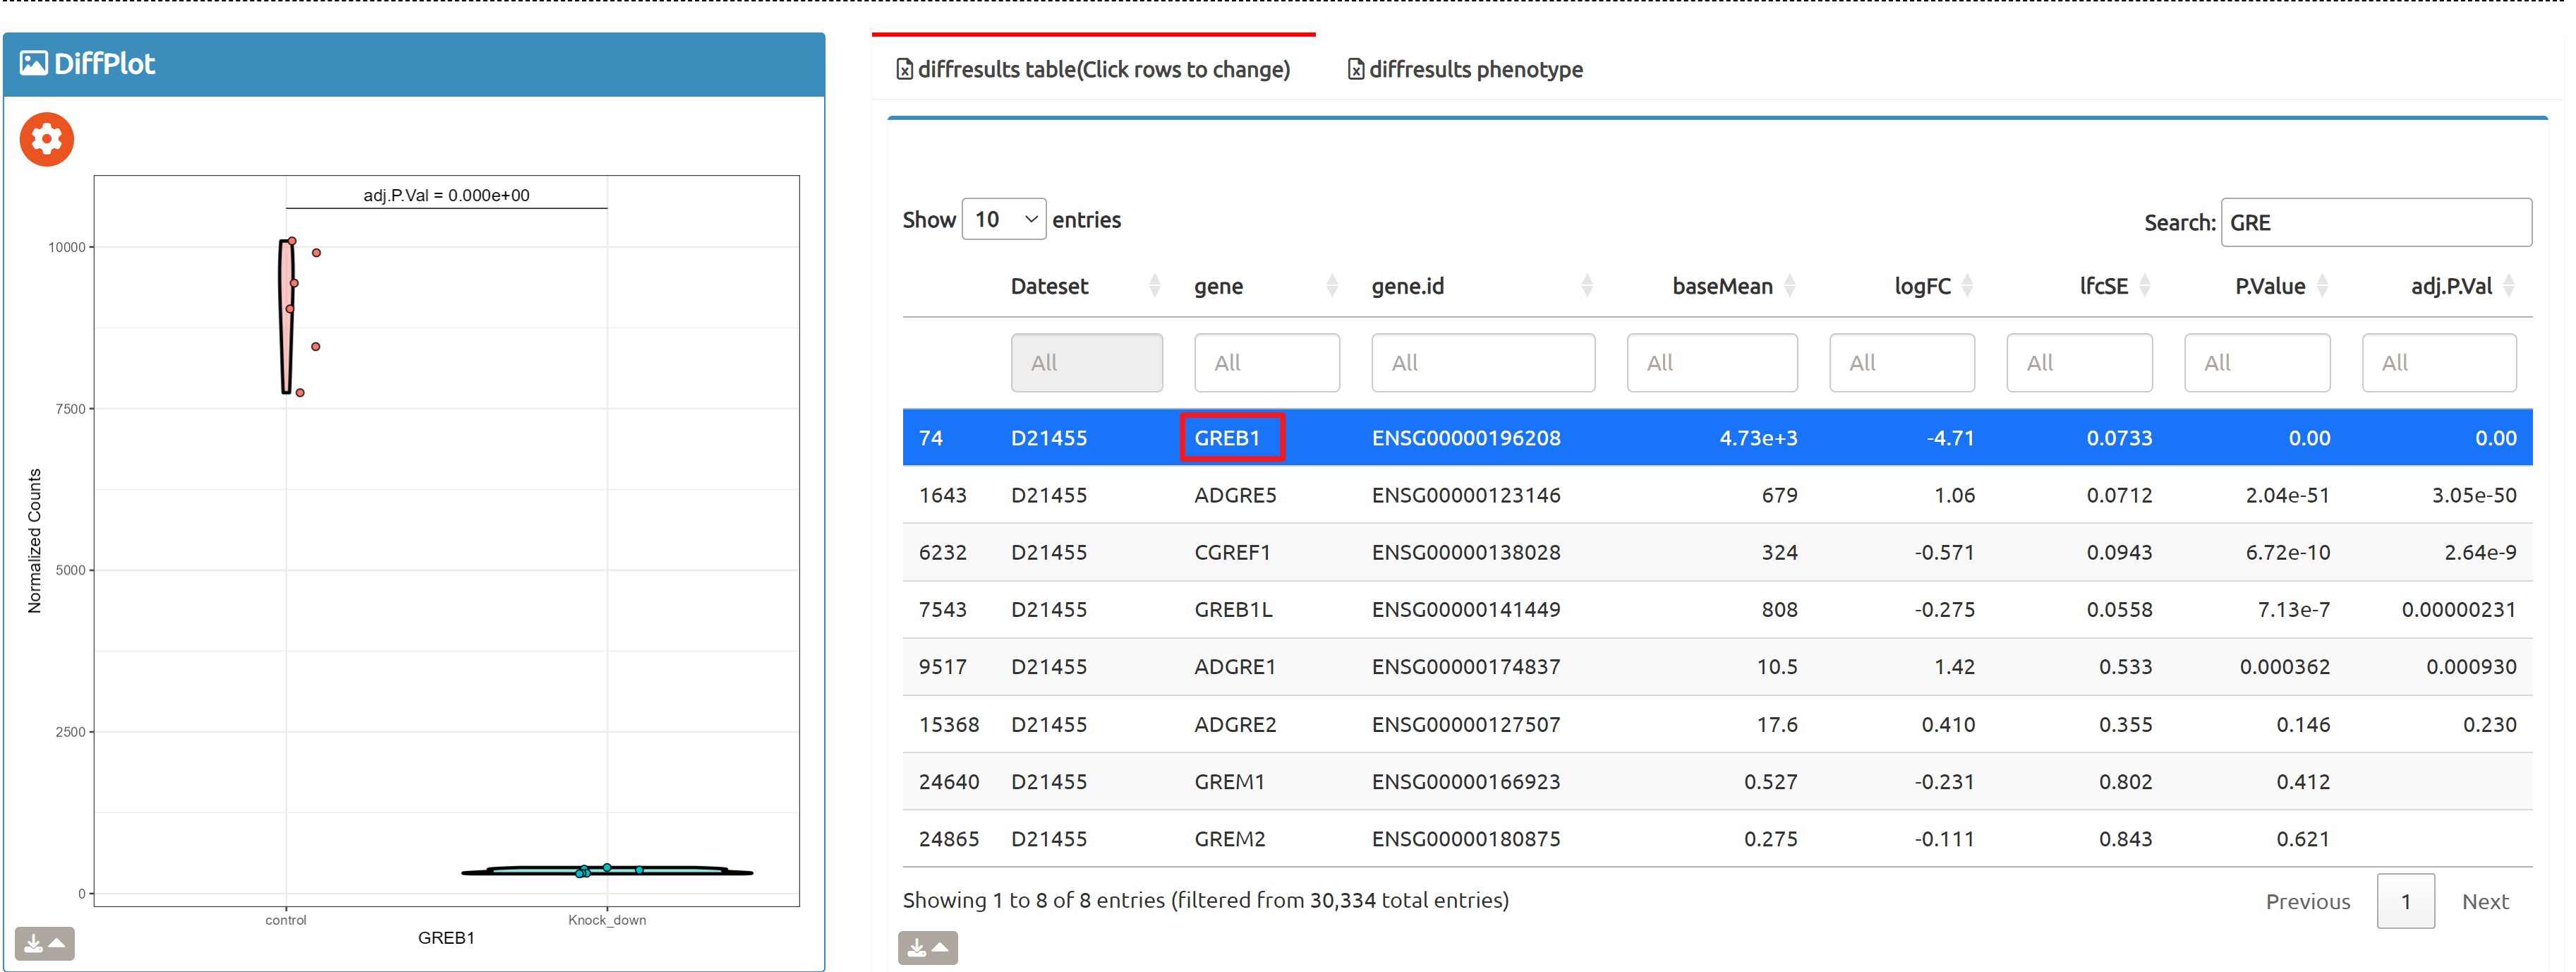
Query
Query by single gene/gene set
BioTrigger
Find triggers of all gene sets
fastGPSA
Enrich analysis with your interested genes
Download
Download all data easily
About
More information
Loading...
Loading...
Loading...
Loading...
 This work is licensed under a Creative Commons Attribution 4.0 International License.